Rows
A modern spreadsheet platform that integrates AI-powered data analysis and automation with seamless business app connectivity.
Product Overview
What is Rows?
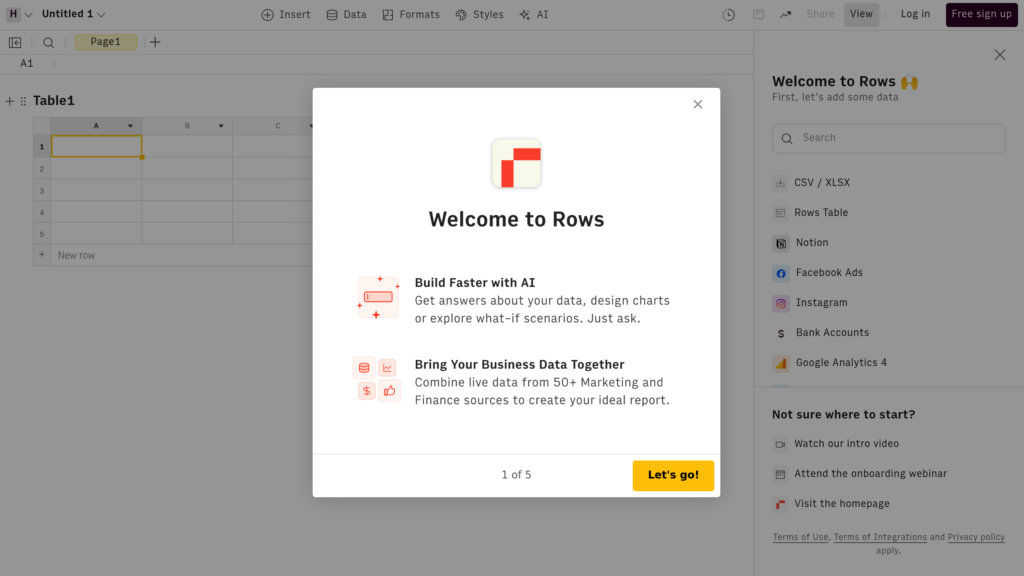
Rows is an advanced spreadsheet tool designed to combine traditional spreadsheet functionalities with powerful AI capabilities and extensive integrations. It enables users to analyze, summarize, and transform data using natural language queries and AI formulas directly within the spreadsheet interface. Rows supports automation of workflows, real-time collaboration, and integration with over 50 popular business applications, making it ideal for teams seeking to streamline data-driven decision-making and reporting without complex coding or formulas.
Key Features
AI Analyst
Leverages natural language processing to perform data analysis, summarization, transformation, and visualization without requiring complex formulas.
Native AI Integration
AI features are built directly into the spreadsheet environment, allowing seamless combination of AI actions with traditional spreadsheet formulas and cell references.
Extensive Integrations
Connects with 50+ business tools such as Google Analytics, Salesforce, HubSpot, MailChimp, and Stripe to import and synchronize data effortlessly.
Automation and Scheduling
Supports scheduling and repeating tasks, enabling users to automate data refreshes, reports, and workflows within the spreadsheet.
Collaborative Environment
Facilitates real-time collaboration and sharing, allowing teams to work together on data analysis and reporting with ease.
User-Friendly Interface
Designed for users familiar with Excel or Google Sheets, Rows offers an intuitive experience with guided wizards and keyboard shortcuts.
Use Cases
- Marketing Analytics : Marketers can integrate data from multiple channels to generate comprehensive reports, track campaigns, and analyze SEO performance.
- Sales Operations : Sales teams can automate lead generation, track sales pipelines, and create dynamic dashboards to monitor performance.
- Financial Planning : Finance teams can build budgets, monitor cash flow, and perform cohort analyses with automated data updates and AI insights.
- Productivity Automation : Teams can automate repetitive spreadsheet tasks, schedule data refreshes, and streamline workflows to save time and reduce errors.
- Data-Driven Decision Making : Business professionals can ask natural language questions about datasets to quickly extract insights and make informed decisions.
FAQs
Rows Alternatives
Coefficient
A no-code platform that seamlessly connects spreadsheets to various business systems, enabling real-time data integration, automation, and AI-powered analysis.
Bricks
AI-powered spreadsheet platform that simplifies data analysis, visualization, and reporting without requiring spreadsheet expertise.
Causal
A powerful financial modeling platform that replaces spreadsheets with live data integrations, scenario planning, and collaborative dashboards for startups and growing businesses.
Supernova AI
No-code analytics platform enabling businesses to connect, explore, and visualize data from 500+ sources without SQL or technical expertise.
Syft Analytics
Interactive and collaborative financial reporting platform that visualizes, analyzes, and forecasts financial data with powerful consolidation and forecasting tools.
GPTExcel
AI-powered spreadsheet automation tool for generating formulas, scripts, queries, and templates across Excel, Google Sheets, and Airtable.
Excelmatic
Conversational Excel assistant that transforms spreadsheet analysis through natural language commands and automated insights.
Formula Bot
AI-powered platform that transforms plain text instructions into spreadsheet formulas, data analysis, and visualizations, streamlining work in Excel and Google Sheets.
Analytics of Rows Website
🇺🇸 US: 9.19%
🇮🇳 IN: 7.39%
🇧🇷 BR: 6.54%
🇫🇷 FR: 4.2%
🇷🇺 RU: 4.13%
Others: 68.55%
