Causal
A powerful financial modeling platform that replaces spreadsheets with live data integrations, scenario planning, and collaborative dashboards for startups and growing businesses.
Community:
Product Overview
What is Causal?
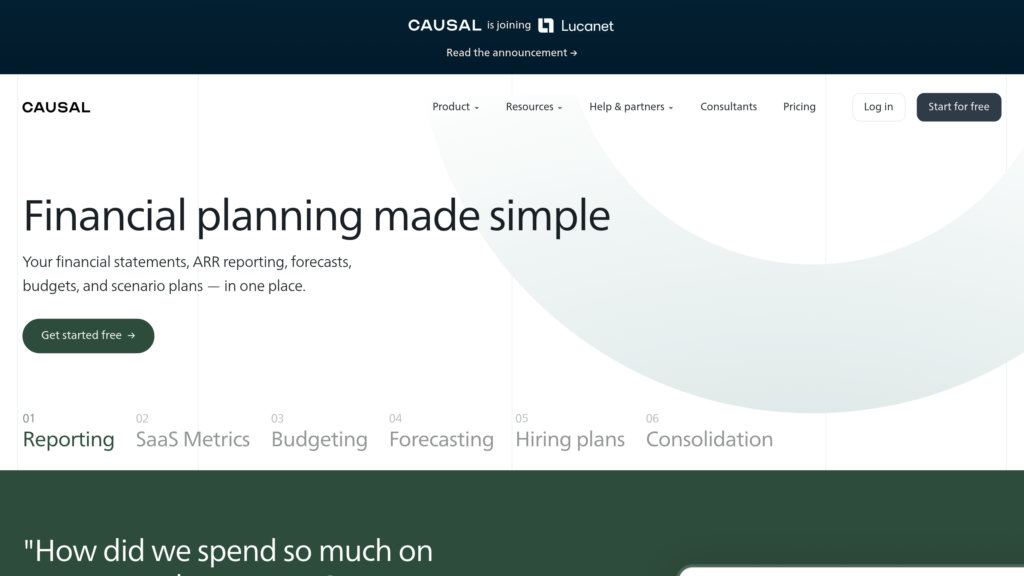
Causal is a finance platform designed to streamline financial modeling, forecasting, and reporting by connecting directly to live data sources such as QuickBooks, Xero, Stripe, and data warehouses. It enables teams to build multi-dimensional models with fewer formulas, automate data refreshes, and compare forecasts against actuals with version control. Causal enhances collaboration through interactive dashboards, commenting, approval workflows, and audit logs, empowering startups and businesses to make faster, data-driven decisions with greater accuracy and less manual effort.
Key Features
Live Data Integrations
Automatically pull in financial and operational data from accounting software, CRMs, and data warehouses to keep models up-to-date without manual imports.
Scenario Planning and Version Control
Create multiple forecast scenarios and save model versions to compare projections against actual results and understand variances.
Collaborative Workflows
Built-in commenting, approval workflows, and multi-user simultaneous editing enable seamless collaboration among finance teams and stakeholders.
Intuitive Modeling Interface
Replace complex spreadsheets with plain-English formulas and a user-friendly interface that reduces errors and improves model auditability.
Customizable Dashboards and Reports
Share interactive charts and tables with teams and investors, enabling real-time insights and data-driven decision-making.
Multi-Currency Consolidation
Automatically convert and consolidate financial data from multiple entities and currencies for a unified business overview.
Use Cases
- Financial Forecasting : Build detailed revenue, expense, and cash flow forecasts that update automatically with live data to track business performance.
- Budgeting and Planning : Develop bottom-up budgets and hiring plans to align financial goals with operational strategies.
- Investor Reporting : Create polished, interactive dashboards and reports to share financial insights with investors and board members.
- Scenario Analysis : Test different business scenarios and growth strategies to understand potential impacts on financial outcomes.
- Team Collaboration : Enable finance teams and department heads to collaborate within the platform, streamlining communication and approvals.
FAQs
Causal Alternatives
Supernova AI
No-code analytics platform enabling businesses to connect, explore, and visualize data from 500+ sources without SQL or technical expertise.
Coefficient
A no-code platform that seamlessly connects spreadsheets to various business systems, enabling real-time data integration, automation, and AI-powered analysis.
Rows
A modern spreadsheet platform that integrates AI-powered data analysis and automation with seamless business app connectivity.
Bricks
AI-powered spreadsheet platform that simplifies data analysis, visualization, and reporting without requiring spreadsheet expertise.
Syft Analytics
Interactive and collaborative financial reporting platform that visualizes, analyzes, and forecasts financial data with powerful consolidation and forecasting tools.
GPTExcel
AI-powered spreadsheet automation tool for generating formulas, scripts, queries, and templates across Excel, Google Sheets, and Airtable.
Excelmatic
Conversational Excel assistant that transforms spreadsheet analysis through natural language commands and automated insights.
Formula Bot
AI-powered platform that transforms plain text instructions into spreadsheet formulas, data analysis, and visualizations, streamlining work in Excel and Google Sheets.
Analytics of Causal Website
🇺🇸 US: 17.5%
🇩🇪 DE: 8.7%
🇳🇬 NG: 8.67%
🇬🇧 GB: 8.49%
🇧🇷 BR: 7.44%
Others: 49.2%
