Syft Analytics
Interactive and collaborative financial reporting platform that visualizes, analyzes, and forecasts financial data with powerful consolidation and forecasting tools.
Community:
InsForge
An agent-native alternative to AWS. Run full-stack apps end to end via CLI and skills
Product Overview
What is Syft Analytics?
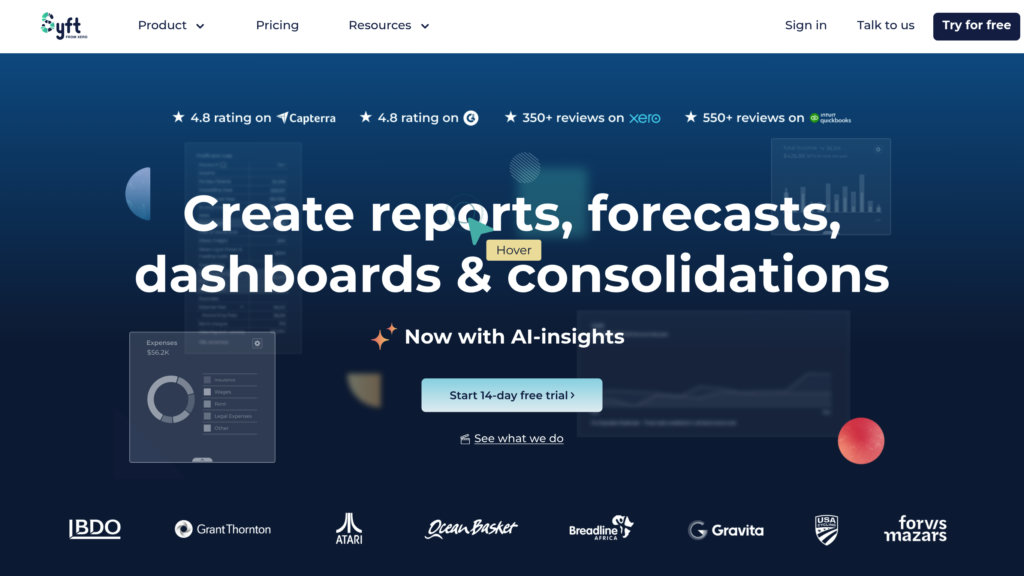
Syft Analytics is a comprehensive financial reporting tool designed for businesses and accountants to create, collaborate on, and explore detailed financial reports. It transforms traditional static reports into interactive, visually engaging documents with real-time collaboration features. Syft supports multi-entity consolidations, driver-based forecasting, and benchmarking, enabling users to monitor key financial metrics, prepare for cash flow challenges, and optimize business performance. The platform integrates with popular accounting software and offers scalable, fast report generation powered by cloud infrastructure.
Key Features
Interactive Collaborative Reporting
Convert static financial reports into interactive documents with commenting, user tagging, and document uploads to facilitate team collaboration.
Advanced Financial Visualizations
Create engaging, customizable graphs and dashboards that bring financial insights to life and support data-driven decision-making.
Powerful Forecasting Tools
Use driver-based forecasting models to predict cash flow and financial outcomes, helping businesses prepare for future challenges.
Multi-Entity Consolidations
Combine unlimited entities with support for eliminations, acquisitions, disposals, fractional ownership, and over 170 currencies for complex group reporting.
Seamless Integration and Export
Connect live data from accounting platforms, export reports to PDF, Excel, Google Sheets, or share secure, interactive live views online.
Scalable Cloud Performance
Leverages cloud infrastructure to deliver fast, reliable report generation even for complex, large-scale financial data sets.
Use Cases
- Financial Reporting and Analysis : Accountants and finance teams can create detailed, interactive reports to analyze company performance and financial health.
- Cash Flow Forecasting : Businesses can use forecasting tools to anticipate cash shortages and plan accordingly to maintain financial stability.
- Multi-Entity Group Reporting : Organizations with multiple subsidiaries or entities can consolidate financial data accurately and efficiently.
- Collaborative Decision-Making : Teams can work together on reports in real-time, adding comments and sharing insights to improve financial decisions.
- Benchmarking and Performance Monitoring : Compare financial KPIs against industry benchmarks to identify strengths and areas for improvement.
FAQs
Syft Analytics Alternatives
PocketGuard
A comprehensive personal finance app that helps users track spending, manage budgets, and optimize savings through automated insights and bill management.
PromisePay
AI-powered platform offering flexible, interest-free payment plans and streamlined government and utility relief distribution to boost revenue recovery and customer satisfaction.
Alaan
AI-powered spend management platform offering instant corporate cards, automated expense tracking, and real-time financial control for businesses.
Digits
End-to-end accounting platform delivering automated bookkeeping, real-time financial insights, invoicing, and bill pay for startups and small businesses.
Puzzle.io
Modern financial management platform designed to automate bookkeeping, deliver real-time financial insights, and streamline accounting for startups and small businesses.
Piere
Comprehensive personal finance app offering effortless budgeting, net worth tracking, and tailored financial plans through intelligent analysis.
Tesorio
Connected financial operations platform that streamlines cash flow forecasting, accounts receivable automation, and collections management for finance teams.
JustPaid
Autonomous revenue operations platform that streamlines billing, invoicing, and payment collection for growing businesses.
Analytics of Syft Analytics Website
🇦🇺 AU: 49.96%
🇬🇧 GB: 26.26%
🇳🇿 NZ: 6.46%
🇺🇸 US: 6.24%
🇿🇦 ZA: 4.74%
Others: 6.34%