Excelmatic
Conversational Excel assistant that transforms spreadsheet analysis through natural language commands and automated insights.
InsForge
An agent-native alternative to AWS. Run full-stack apps end to end via CLI and skills
Product Overview
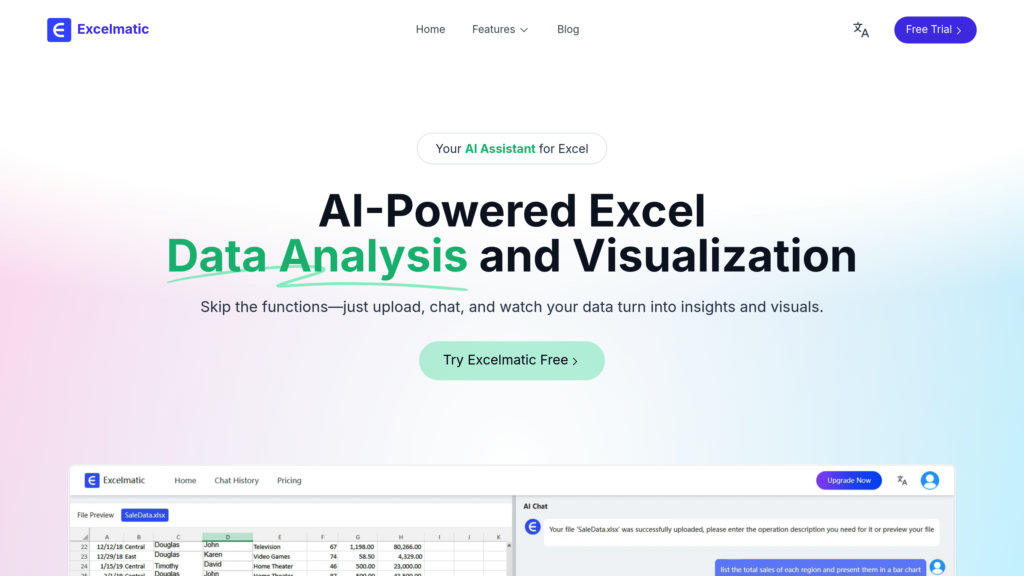
What is Excelmatic?
Excelmatic is a revolutionary Excel assistant that enables users to analyze data, create visualizations, and generate reports through simple conversational commands. Instead of wrestling with complex formulas and functions, users can upload their Excel or CSV files and interact with their data using plain English. The platform automatically processes requests like 'calculate monthly sales' or 'create a bar chart for quarterly revenue' and delivers instant insights, professional charts, and comprehensive analysis reports. Designed for business professionals, analysts, and anyone working with spreadsheets, Excelmatic eliminates the technical learning curve while providing enterprise-level data analysis capabilities.
Key Features
Natural Language Processing
Interact with Excel data using conversational commands instead of complex formulas, making data analysis accessible to users of all skill levels.
Automated Chart Generation
Instantly create professional visualizations including bar charts, pie charts, and line graphs with simple text requests for immediate data insights.
Intelligent Data Analysis
Automatically identifies trends, patterns, and key metrics in your data while providing actionable recommendations and business insights.
Multi-Format Support
Works seamlessly with Excel (.xlsx), CSV, and other common spreadsheet formats, supporting complex multi-sheet workbooks and various data types.
Real-Time Data Processing
Processes large datasets efficiently and provides instant responses to analytical queries without requiring manual formula creation or pivot table setup.
Use Cases
- Business Analytics : Business analysts can quickly extract insights from complex datasets, generate reports, and identify trends without writing SQL queries or complex Excel formulas.
- Sales Performance Tracking : Sales teams can analyze revenue data, track performance metrics, and create visual reports to monitor quarterly results and identify top-performing products.
- Marketing Campaign Analysis : Marketing professionals can evaluate campaign performance, analyze customer behavior data, and measure ROI through simple conversational queries.
- Financial Reporting : Finance teams can automate financial analysis, forecast revenue trends, and generate executive dashboards for strategic decision-making.
- Customer Data Management : Customer service teams can organize client information, segment customer data, and extract actionable insights for improved service delivery.
FAQs
Excelmatic Alternatives
Syft Analytics
Interactive and collaborative financial reporting platform that visualizes, analyzes, and forecasts financial data with powerful consolidation and forecasting tools.
Rows
A modern spreadsheet platform that integrates AI-powered data analysis and automation with seamless business app connectivity.
Formula Bot
AI-powered platform that transforms plain text instructions into spreadsheet formulas, data analysis, and visualizations, streamlining work in Excel and Google Sheets.
CaptivateIQ
A flexible, scalable sales commission management platform that automates complex incentive plans with real-time visibility and transparency.
Ajelix
AI-powered data analytics and Excel assistant platform offering formula generation, data visualization, and business intelligence tools.
RowSpeak
Excel-focused data agent that turns messy spreadsheets, CSVs, PDFs, and image tables into charts, dashboards, and business-ready reports through plain-language queries.
Equidam
An advanced online valuation platform that empowers startups and professionals to generate real-time, data-driven company valuations with detailed benchmarking and customizable reports.
Forecastr
Comprehensive financial forecasting software that combines customizable modeling tools with expert CFO support to help startups and small businesses plan growth, manage cash flow, and prepare for fundraising.
Analytics of Excelmatic Website
🇰🇷 KR: 6.04%
🇧🇷 BR: 4.02%
🇬🇹 GT: 4.02%
🇺🇸 US: 3.7%
🇹🇼 TW: 3.65%
Others: 78.57%