Bricks
AI-powered spreadsheet platform that simplifies data analysis, visualization, and reporting without requiring spreadsheet expertise.
Community:
InsForge
An agent-native alternative to AWS. Run full-stack apps end to end via CLI and skills
Product Overview
What is Bricks?
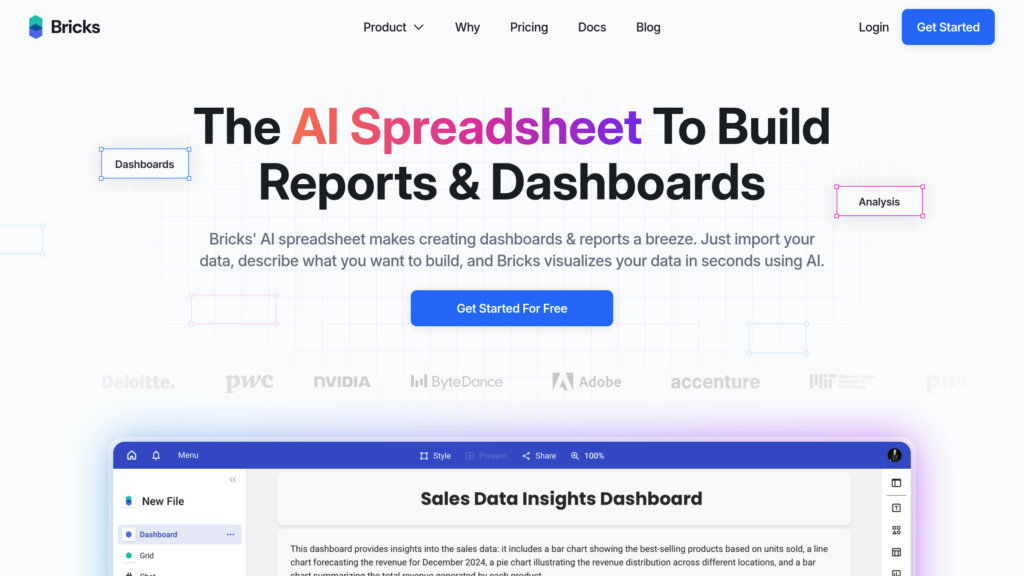
Bricks is an AI-first spreadsheet and dashboard tool designed to enable users to create, analyze, and visualize data effortlessly. It integrates advanced AI capabilities to automate data import, cleaning, formula generation, and chart creation, allowing users to build reports, dashboards, and presentations quickly. Bricks supports collaboration with team roles, chat, and sharing features, and offers a rich library of pre-built visual blocks such as calendars, timelines, org charts, and Kanban boards. Its secure cloud infrastructure ensures data privacy, making it suitable for business teams and individuals seeking an intuitive, AI-enhanced data workspace.
Key Features
AI-Powered Spreadsheet Automation
Automates data import, cleaning, formula creation, and analysis using natural language prompts, eliminating the need for manual formula writing.
Visual Board & Reporting Tools
Create dynamic charts, dashboards, infographics, and presentations seamlessly connected to live spreadsheet data with drag-and-drop ease.
Pre-Built Blocks & Templates
Access a comprehensive library of customizable blocks including calendars, timelines, flowcharts, roadmaps, and Kanban boards to accelerate report building.
Collaboration & Team Management
Supports team roles, permissions, chat, comments, and revision history to facilitate efficient teamwork and secure data sharing.
Flexible Pricing Plans
Offers multiple subscription tiers including free, personal, premium, teams, and enterprise plans to fit diverse user needs.
Data Privacy & Security
Ensures all data is encrypted, private, and never used for AI training, hosted securely on AWS infrastructure.
Use Cases
- Business Reporting & Dashboards : Create real-time dashboards and reports for sales, marketing, finance, and operations teams without needing data analyst skills.
- Project Management & Planning : Use timelines, roadmaps, and Kanban boards to track projects and visualize progress with AI-assisted data updates.
- Data Analysis & What-If Scenarios : Leverage AI to perform advanced data analysis, pivot tables, and scenario planning to support decision-making.
- Collaborative Team Workspaces : Enable teams to work together on documents, spreadsheets, and presentations with integrated communication and version control.
- Visual Content Creation : Generate charts, infographics, and organizational charts directly from spreadsheet data for presentations and stakeholder communication.
FAQs
Bricks Alternatives
Rows
A modern spreadsheet platform that integrates AI-powered data analysis and automation with seamless business app connectivity.
Coefficient
A no-code platform that seamlessly connects spreadsheets to various business systems, enabling real-time data integration, automation, and AI-powered analysis.
RowSpeak
Excel-focused data agent that turns messy spreadsheets, CSVs, PDFs, and image tables into charts, dashboards, and business-ready reports through plain-language queries.
Causal
A powerful financial modeling platform that replaces spreadsheets with live data integrations, scenario planning, and collaborative dashboards for startups and growing businesses.
Supernova AI
No-code analytics platform enabling businesses to connect, explore, and visualize data from 500+ sources without SQL or technical expertise.
Syft Analytics
Interactive and collaborative financial reporting platform that visualizes, analyzes, and forecasts financial data with powerful consolidation and forecasting tools.
Formula Bot
AI-powered platform that transforms plain text instructions into spreadsheet formulas, data analysis, and visualizations, streamlining work in Excel and Google Sheets.
GPTExcel
AI-powered spreadsheet automation tool for generating formulas, scripts, queries, and templates across Excel, Google Sheets, and Airtable.
Analytics of Bricks Website
🇺🇸 US: 24.74%
🇨🇦 CA: 9.33%
🇮🇳 IN: 5.52%
🇬🇧 GB: 4.85%
🇻🇳 VN: 3.56%
Others: 51.99%