ExcelDashboard AI
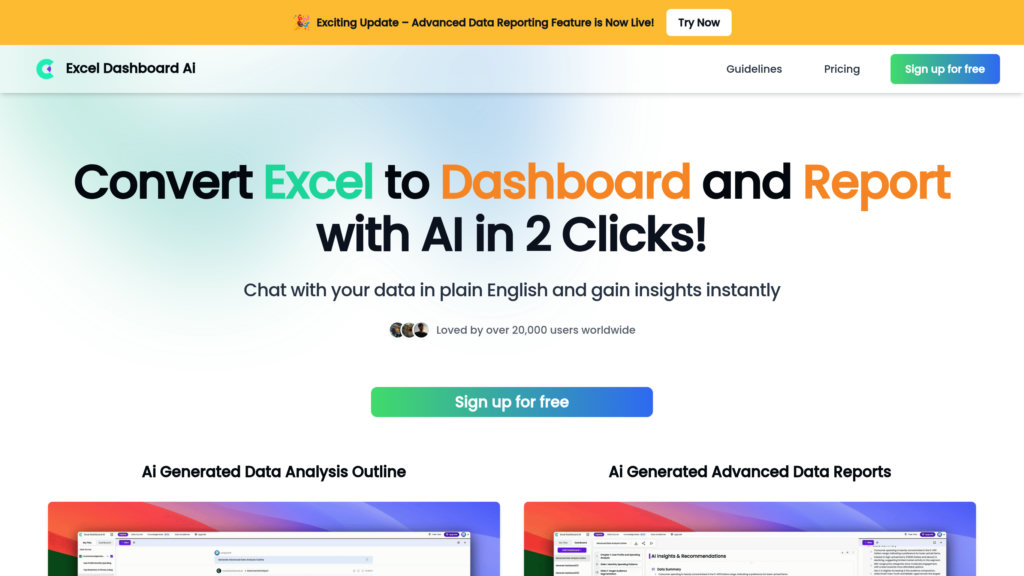
AI-powered tool that converts Excel spreadsheets into interactive dashboards and detailed reports with natural language interaction.
Community:
Product Overview
What is ExcelDashboard AI?
ExcelDashboard AI is an intelligent data assistant designed to transform raw Excel data into visually rich, interactive dashboards and comprehensive analysis reports effortlessly. With just a couple of clicks, users can generate multiple data analysis perspectives, customize dashboards using plain English commands, and produce detailed, editable reports. Backed by Microsoft for Startups Founders Hub, the platform caters to users ranging from novices to professionals, streamlining data visualization and accelerating insights without requiring coding skills.
Key Features
Instant Dashboard Creation
Convert Excel data into interactive dashboards with two clicks, automating chart generation and visualization.
Natural Language Data Interaction
Engage with data by asking questions and commanding analysis in plain English to receive immediate insights.
Multi-Dimensional Batch Analysis
Generate and customize up to 10 different data analysis dimensions rapidly to explore diverse perspectives.
Comprehensive Editable Reports
Produce detailed reports including fully editable charts derived from dashboards, suitable for presentations and sharing.
AI-Powered Insight Interpretation
AI interprets chart meanings and highlights key information, simplifying data understanding.
Flexible Subscription Plans
Offers free and paid plans with varying AI credits, file upload limits, and premium features to suit different user needs.
Use Cases
- Business Data Analysis : Professionals can quickly convert raw Excel data into actionable dashboards and reports for decision-making.
- Marketing Performance Tracking : Marketers can generate visual insights and multi-angle analysis to monitor campaign effectiveness.
- Operations and Financial Reporting : Operations teams and finance professionals can automate report generation and explore data trends effortlessly.
- Educational and Personal Projects : Students and individuals can simplify complex data analysis and create clear visual reports without technical expertise.
- Data Exploration via Natural Language : Users can interact with their data using simple English queries to uncover insights without manual formulas.
FAQs
ExcelDashboard AI Alternatives
Tableau
A leading visual analytics platform that empowers users to explore, analyze, and share data insights easily with AI-powered features and flexible deployment options.
Venngage
User-friendly online infographic and visual content design platform with extensive templates and AI-powered accessibility features.
Bricks
AI-powered spreadsheet platform that simplifies data analysis, visualization, and reporting without requiring spreadsheet expertise.
Powerdrill AI
AI-powered data analysis platform that transforms raw datasets into instant insights, visualizations, and presentations through natural language interaction.
Graphy
AI-powered data visualization platform enabling fast creation of beautiful, interactive graphs and dashboards with seamless data integration.
Polymer Search
AI-driven embedded analytics platform offering seamless integration, AI-assisted data storytelling, and customizable dashboards.
Explo
Embedded analytics platform enabling customizable dashboards, self-serve reporting, and AI-powered data exploration for SaaS and product teams.
Basedash
A business intelligence platform that enables users to create data visualizations and dashboards through natural language interaction and spreadsheet-like database editing.
Analytics of ExcelDashboard AI Website
🇮🇳 IN: 34.64%
🇸🇦 SA: 12.32%
🇺🇸 US: 12.08%
🇵🇪 PE: 6.81%
🇵🇰 PK: 6.77%
Others: 27.38%
