Explo
Embedded analytics platform enabling customizable dashboards, self-serve reporting, and AI-powered data exploration for SaaS and product teams.
Community:
Product Overview
What is Explo?
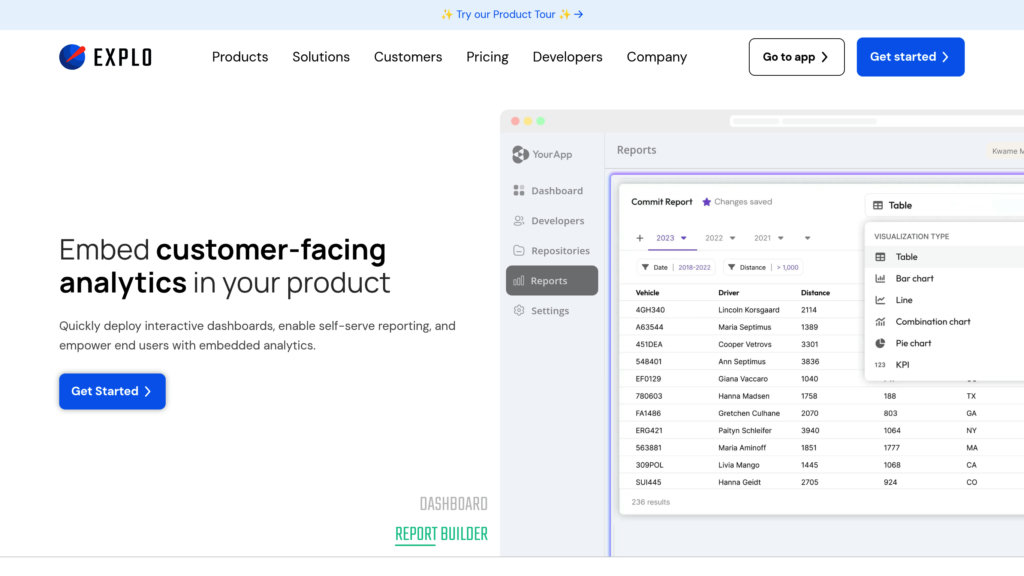
Explo is a comprehensive embedded analytics solution designed for product and engineering teams to integrate powerful, customizable data visualizations and reporting directly into their platforms. It empowers end users to explore data through interactive dashboards, build reports with a self-service report builder, and leverage AI-driven analytics for natural language querying. Explo supports seamless integration with various databases and warehouses, offers enterprise-grade security compliance, and accelerates time-to-market for embedded analytics features.
Key Features
Customizable Embedded Dashboards
Create interactive, white-labeled dashboards that users can tailor with filters, drill-downs, and cross-filtering to meet specific business needs.
Self-Service Report Builder
Enable end users to build and customize reports on-demand, facilitating ad hoc data exploration without developer intervention.
AI-Powered Data Exploration
Leverage large language models to allow users to ask free-text questions and receive relevant charts or graphs automatically.
Robust Security and Compliance
SOC 2 Type 2, GDPR, and HIPAA compliant with options for on-premise deployments and region-specific data stacks.
Version Control and Collaboration
Track dashboard changes, manage multiple environments, and revert or promote versions to align with release cycles.
Seamless Data Integration
Connect directly to relational databases and data warehouses such as MySQL, PostgreSQL, Snowflake, and others for real-time analytics.
Use Cases
- SaaS Product Analytics : Embed customizable analytics dashboards within SaaS platforms to provide customers with tailored insights and reporting.
- Customer-Facing Reporting : Deliver self-service reporting tools that reduce internal report requests and empower customers to explore their own data.
- Operational and Sales Metrics : Share vital business metrics such as sales, inventory, and operational performance through interactive dashboards.
- Healthcare and Compliance Reporting : Utilize Explo’s secure analytics capabilities to meet HIPAA requirements while providing real-time device and equipment metrics.
- Marketing and Support Dashboards : Equip marketing and support teams with detailed analytics to improve customer engagement and operational efficiency.
FAQs
Explo Alternatives
Draxlr
No-code BI platform for SQL data visualization, dashboard building, alerting, and embedding with AI-powered insights.
Polymer Search
AI-driven embedded analytics platform offering seamless integration, AI-assisted data storytelling, and customizable dashboards.
Snow Software
Comprehensive technology intelligence platform delivering software asset management, SaaS management, and IT asset insights with AI-powered automation.
Cube
Universal semantic layer platform that unifies data models and delivers consistent metrics across BI tools, APIs, and LLM applications.
Heap
Comprehensive digital insights platform offering automatic, retroactive product analytics with advanced data science and multi-device tracking.
Visible.vc
A comprehensive investor relationship platform that streamlines fundraising, stakeholder communication, and portfolio management for startups and venture capital firms.
OWOX BI
A scalable data democratization and marketing analytics platform that centralizes business data, automates reporting, and empowers users with real-time, reliable insights.
Databox
Self-service business intelligence platform that centralizes data from 130+ integrations into real-time dashboards, reports, and automated insights.
Analytics of Explo Website
🇺🇸 US: 23.87%
🇮🇳 IN: 9.62%
🇧🇷 BR: 9.52%
🇻🇳 VN: 6.32%
🇮🇩 ID: 4.28%
Others: 46.38%