Graphy
AI-powered data visualization platform enabling fast creation of beautiful, interactive graphs and dashboards with seamless data integration.
Community:
Product Overview
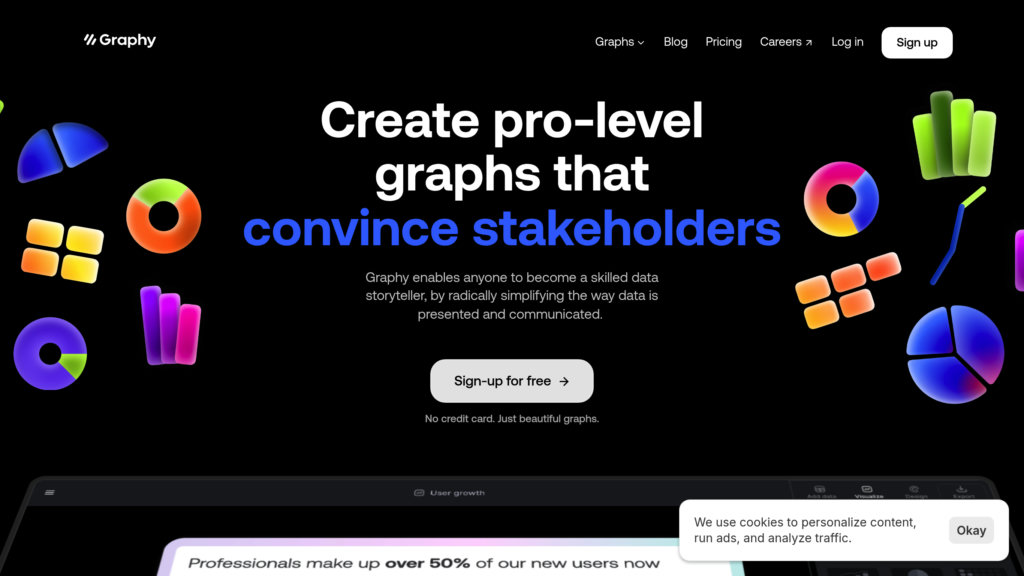
What is Graphy?
Graphy is a next-generation data visualization tool designed to simplify and accelerate the process of creating professional graphs and dashboards. It uses AI to generate insightful visualizations that help data-driven teams communicate effectively and make informed decisions. With a user-friendly, no-code interface, Graphy supports instant data import from multiple sources, rich customization, and collaborative sharing options. Its focus on storytelling through data makes it ideal for teams needing quick, stunning, and actionable visual reports.
Key Features
AI-Generated Insights and Graphs
Leverages AI algorithms to analyze data and recommend the most suitable graph types and visual enhancements for clearer communication.
Seamless Data Integration
Supports one-click data import from sources like Google Sheets and direct pasting, eliminating manual data entry.
Interactive and Customizable Visuals
Enables creation of interactive graphs with customizable colors, fonts, labels, and annotations to highlight key insights.
Collaboration and Sharing
Facilitates real-time team collaboration and easy sharing through embeds, interactive links, or images.
Intuitive No-Code Interface
Designed for users of all skill levels with a simple, fast, and intuitive interface requiring no technical expertise.
Rich Storytelling Tools
Includes features like visual annotations, trend lines, and goal markers to make data narratives compelling and actionable.
Use Cases
- Business Reporting : Create clear and impactful reports to communicate performance metrics and trends to stakeholders.
- Marketing Analytics : Visualize campaign data and customer insights to optimize marketing strategies and demonstrate ROI.
- Team Collaboration : Share interactive dashboards and graphs with teams for joint analysis and faster decision-making.
- Educational Data Presentation : Help educators and students visualize complex data simply and engagingly for better understanding.
- Product Management : Track product metrics and user feedback visually to prioritize features and improvements.
FAQs
Graphy Alternatives
Tableau
A leading visual analytics platform that empowers users to explore, analyze, and share data insights easily with AI-powered features and flexible deployment options.
Venngage
User-friendly online infographic and visual content design platform with extensive templates and AI-powered accessibility features.
Piktochart
A user-friendly online platform for creating professional infographics, presentations, and reports without requiring design experience.
ChartGen AI
Data visualization platform that transforms CSV and Excel files into professional charts through natural language descriptions, supporting nine chart types with enterprise-grade security.
RowSpeak
Excel-focused data agent that turns messy spreadsheets, CSVs, PDFs, and image tables into charts, dashboards, and business-ready reports through plain-language queries.
Explo
Embedded analytics platform enabling customizable dashboards, self-serve reporting, and AI-powered data exploration for SaaS and product teams.
Lightdash
Open-source BI platform that transforms dbt projects into interactive, self-serve analytics for teams and businesses.
vizGPT
Conversational data visualization and analytics platform that lets users create interactive charts and dashboards through natural language or drag-and-drop tools.
Analytics of Graphy Website
🇮🇳 IN: 13.92%
🇰🇭 KH: 11.72%
🇺🇸 US: 8.25%
🇷🇺 RU: 3.25%
🇲🇾 MY: 2.96%
Others: 59.9%