Venngage
User-friendly online infographic and visual content design platform with extensive templates and AI-powered accessibility features.
Community:
Product Overview
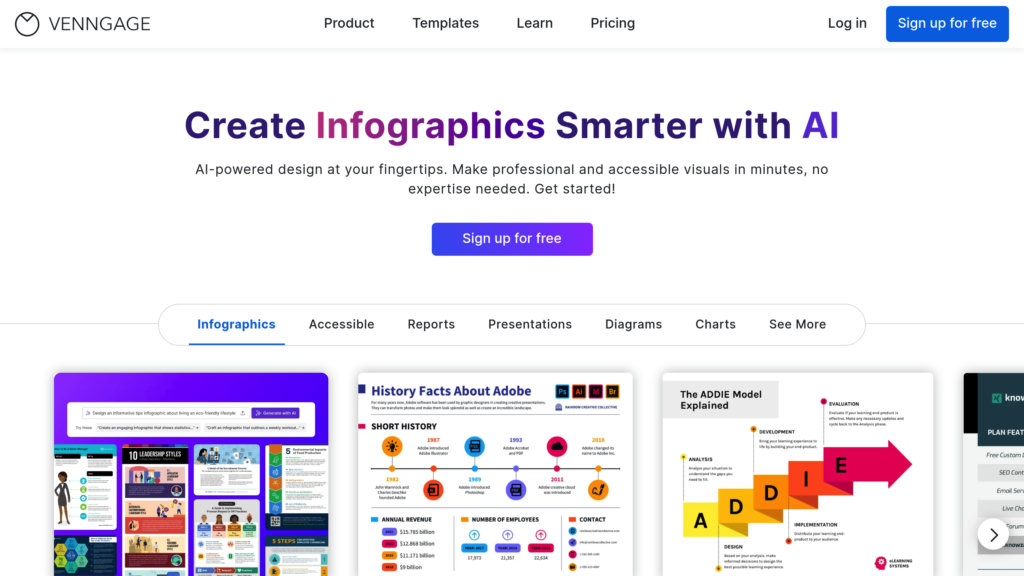
What is Venngage?
Venngage is a versatile infographic maker designed for individuals and businesses to create engaging visuals such as infographics, reports, presentations, and marketing materials without requiring advanced design skills. It offers a drag-and-drop editor, a vast library of customizable templates, icons, and images, and supports data visualization through charts and diagrams. Venngage emphasizes accessibility with built-in tools like alt text, color contrast checking, and accessible PDF exports, making it suitable for diverse users including marketers, educators, and professionals. The platform also supports team collaboration and brand consistency through customizable brand kits.
Key Features
Extensive Template Library
Access over 10,000 professional templates tailored for various business categories and use cases, enabling quick and polished visual content creation.
AI-Powered Accessibility Tools
Integrated AI features help generate alt text, improve text quality, and ensure color contrast compliance, facilitating the creation of accessible visuals.
Drag-and-Drop Editor
Intuitive editing interface suitable for users of all skill levels, allowing easy customization of templates, charts, icons, and images.
Branding and Collaboration
Create custom brand kits with logos, colors, and fonts; collaborate in real-time with team members to maintain brand consistency.
Advanced Data Visualization
Supports importing data from Excel or CSV and offers various chart types including bar, column, bubble, and funnel charts to visualize complex information.
Multi-Format Export
Export designs in multiple formats such as PNG, PDF, and interactive HTML to suit different presentation and sharing needs.
Use Cases
- Marketing and Social Media : Create compelling infographics and visuals to enhance marketing campaigns and social media engagement.
- Business Reporting : Design professional reports and presentations that simplify complex data for stakeholders.
- Education and Training : Develop accessible learning materials and visual aids to support student engagement and comprehension.
- Team Collaboration : Enable teams to co-create and maintain brand-aligned visual content efficiently, even when working remotely.
- Nonprofit Storytelling : Produce impactful visual stories that inspire action and communicate mission-driven messages effectively.
FAQs
Venngage Alternatives
iStock
A leading stock content platform offering exclusive royalty-free images, videos, vectors, and AI-powered creative tools.
123RF
Comprehensive stock content platform offering millions of royalty-free images, vectors, videos, and audio with AI-powered search and editing tools.
Vexels
A specialized design platform offering extensive professional graphics and AI-powered tools tailored for print-on-demand merch creation.
Playground AI
User-friendly AI-powered image generation and editing platform offering customizable templates, mixed image editing, and content-aware tools.
Mixboard
Collaborative visual concepting platform that transforms text prompts and images into polished mood boards with intelligent AI editing and real-time team collaboration.
BrandBird
Web-based screenshot editor that transforms ordinary screenshots into professional graphics with customizable templates, 3D effects, mockups, and branding tools for social media and marketing content.
Flux Pro AI
Advanced AI platform offering rapid, high-quality image and video generation with multiple specialized models.
Mew Design
AI design agent that creates smart, brand-aware posters through collaborative specialist AI agents using natural language input.
Analytics of Venngage Website
🇺🇸 US: 18.41%
🇮🇳 IN: 9.66%
🇧🇷 BR: 6.67%
🇵🇭 PH: 5.99%
🇨🇴 CO: 4.84%
Others: 54.42%