VisActor
Comprehensive intelligent visualization platform focusing on narrative visualization and AI-driven data storytelling.
Community:
InsForge
An agent-native alternative to AWS. Run full-stack apps end to end via CLI and skills
Product Overview
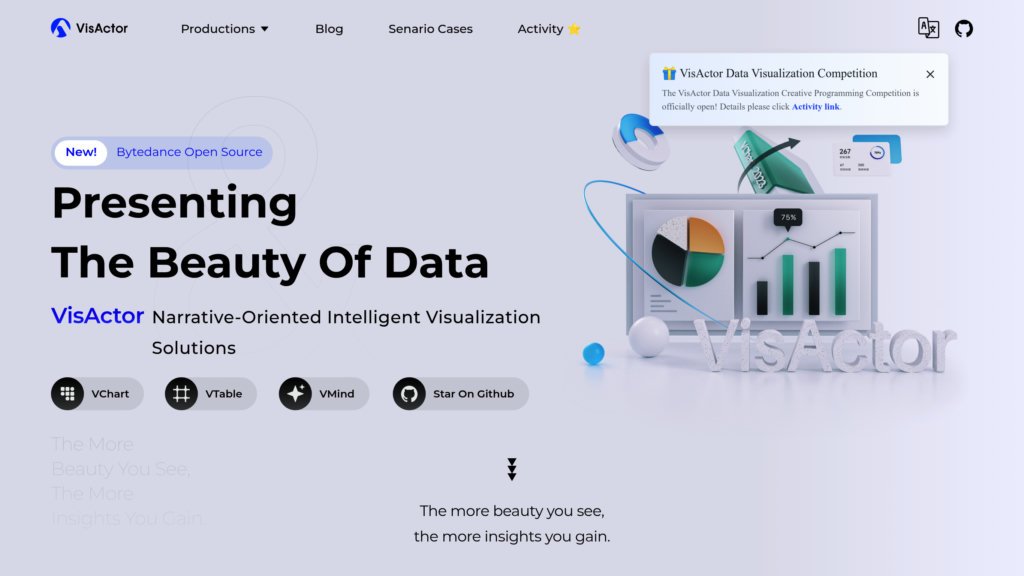
What is VisActor?
VisActor is a full-process visualization solution designed to deliver narrative-oriented and intelligent visualization experiences. It integrates multiple modular components including a rendering engine, visualization grammar, data analysis tools, charting (VChart), tabular data analysis (VTable), GIS, graph visualization, and AI-powered intelligent visualization (VMind). The platform emphasizes reducing complexity in data visualization through natural language interfaces and advanced rendering capabilities, enabling users to create rich, animated, and interactive visual stories with ease.
Key Features
Narrative-Oriented Visualization
Supports storytelling through expressive charts and animations, allowing users to communicate data insights effectively.
High-Performance Rendering Engine
VRender engine delivers smooth rendering of large datasets, supporting millions of data points with fast updates and multi-chart layouts.
Multi-Dimensional Data Analysis Tables
VTable offers powerful pivot tables, combined charts, and flexible cell rendering (text, images, videos, sparklines) for comprehensive data exploration.
AI-Powered Intelligent Visualization
VMind leverages large language models and AI to enable natural language-driven chart generation and intelligent recommendations, simplifying visualization creation.
Extensive Chart Types and Customization
VChart supports a wide variety of chart types including bar, line, pie, radar, Gantt, heatmaps, and more, with rich animation and interaction capabilities.
Flexible Interaction and Theming
Supports advanced user interactions like sorting, filtering, drag-and-drop, and customizable themes to tailor visualizations to diverse environments.
Use Cases
- Business Intelligence Dashboards : Create dynamic, interactive BI dashboards with real-time data updates and multi-chart layouts for executive decision-making.
- Data Storytelling and Reporting : Build narrative visualizations that combine charts and text to present data insights clearly and engagingly.
- Large-Scale Data Visualization : Render and analyze millions of data points efficiently using high-performance tables and charts for big data scenarios.
- Automated Visualization Generation : Use AI-driven VMind to generate charts and visual stories from natural language inputs without coding.
- Office and Enterprise Applications : Integrate rich visualization components compatible with various office environments to enhance reporting and presentations.
FAQs
VisActor Alternatives
Chat2CSV
AI-powered platform that transforms CSV data into diverse charts through natural language commands, ensuring ease of use and strong data privacy.
vizGPT
Conversational data visualization and analytics platform that lets users create interactive charts and dashboards through natural language or drag-and-drop tools.
ChartGen AI
Data visualization platform that transforms CSV and Excel files into professional charts through natural language descriptions, supporting nine chart types with enterprise-grade security.
Medallia
Enterprise experience management platform that captures every customer and employee signal across all channels and turns it into clear, prioritized actions.
Tableau
A leading visual analytics platform that empowers users to explore, analyze, and share data insights easily with AI-powered features and flexible deployment options.
Checkr
AI-powered background screening platform delivering fast, accurate, and compliant hiring checks with seamless integrations and superior candidate experience.
Energent.ai
Intelligent data analysis platform that processes multiple file types to deliver actionable insights through automated workflows and visual dashboards.
Bricks
AI-powered spreadsheet platform that simplifies data analysis, visualization, and reporting without requiring spreadsheet expertise.
Analytics of VisActor Website
🇨🇳 CN: 76.42%
🇺🇸 US: 6.28%
🇰🇷 KR: 2.78%
🇧🇷 BR: 2.72%
🇭🇰 HK: 2.64%
Others: 9.15%