Chat2CSV
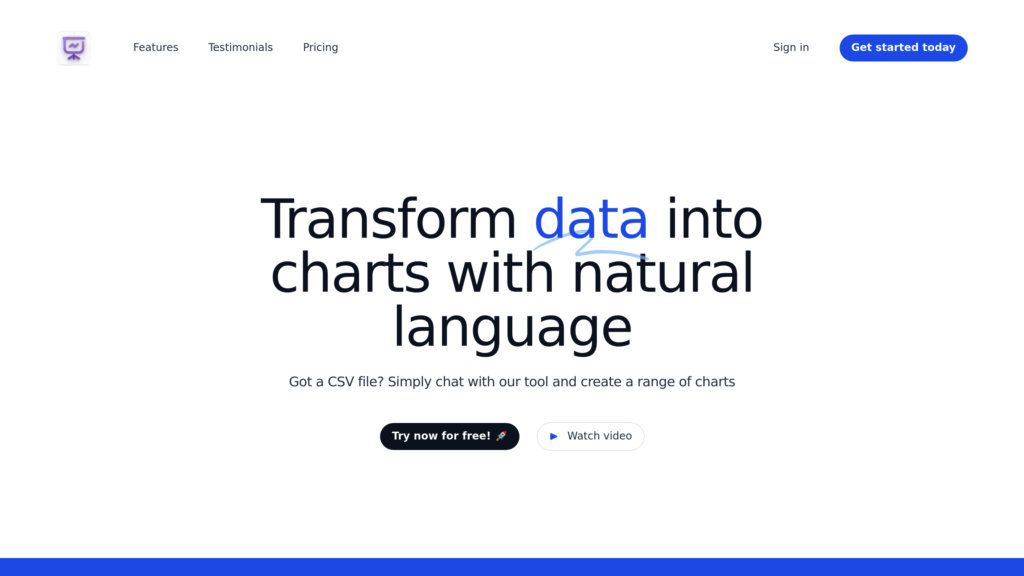
AI-powered platform that transforms CSV data into diverse charts through natural language commands, ensuring ease of use and strong data privacy.
Community:
Product Overview
What is Chat2CSV?
Chat2CSV is an intuitive data visualization tool designed to convert CSV files into various chart types using simple natural language instructions. Users upload CSV files with headers and instruct the AI in plain English to generate charts such as bar charts, line graphs, pie charts, and scatter plots. The platform’s AI not only executes commands but also suggests the most suitable chart types based on the data, enhancing analysis and insights. Emphasizing user privacy, Chat2CSV processes only necessary metadata on its servers while keeping the actual data securely on the user's side. Its user-friendly interface requires no coding skills, making data visualization accessible to professionals across fields like marketing, finance, and data science.
Key Features
Natural Language Interaction
Users create charts by simply typing commands in plain English, eliminating the need for coding or scripting.
AI-Powered Chart Suggestions
The AI analyzes the data to recommend the most appropriate chart types for effective visualization.
Wide Range of Chart Types
Supports diverse visualizations including bar charts, line graphs, pie charts, scatter plots, and more.
Strong Data Privacy
Only metadata is processed on servers; actual CSV data remains on the user's device, ensuring high privacy standards.
User-Friendly Interface
Designed for ease of use with no technical skills required, making it accessible to users of all backgrounds.
Flexible Pricing Plans
Offers a free tier with basic limits and a premium plan featuring higher query limits, larger file support, and secure cloud storage.
Use Cases
- Business Data Analysis : Professionals can quickly visualize sales, inventory, and financial data for better decision-making.
- Marketing Insights : Marketers can generate charts to identify consumer trends and campaign performance without technical barriers.
- Accounting and Finance : Accountants can transform CSV financial records into clear visual reports effortlessly.
- Data Science Exploration : Data scientists can rapidly create visualizations to detect patterns and extract insights from datasets.
- Educational Use : Students and educators can visualize data for projects and presentations using simple natural language commands.
FAQs
Chat2CSV Alternatives
ChartGen AI
Data visualization platform that transforms CSV and Excel files into professional charts through natural language descriptions, supporting nine chart types with enterprise-grade security.
VisActor
Comprehensive intelligent visualization platform focusing on narrative visualization and AI-driven data storytelling.
vizGPT
Conversational data visualization and analytics platform that lets users create interactive charts and dashboards through natural language or drag-and-drop tools.
Tableau
A leading visual analytics platform that empowers users to explore, analyze, and share data insights easily with AI-powered features and flexible deployment options.
Checkr
AI-powered background screening platform delivering fast, accurate, and compliant hiring checks with seamless integrations and superior candidate experience.
UserTesting Human Insight Platform
Comprehensive user research platform offering remote usability testing, participant recruitment, and AI-powered insights for product optimization.
Flash
AI-powered shopping assistant that consolidates order tracking, spending insights, and rewards into a single, secure platform.
PostHog
An open-source, all-in-one product analytics platform that integrates user behavior tracking, session replay, feature flags, A/B testing, and more.
Analytics of Chat2CSV Website
🇮🇳 IN: 100%
Others: 0%
