ChartGen AI
Data visualization platform that transforms CSV and Excel files into professional charts through natural language descriptions, supporting nine chart types with enterprise-grade security.
Community:
InsForge
An agent-native alternative to AWS. Run full-stack apps end to end via CLI and skills
Product Overview
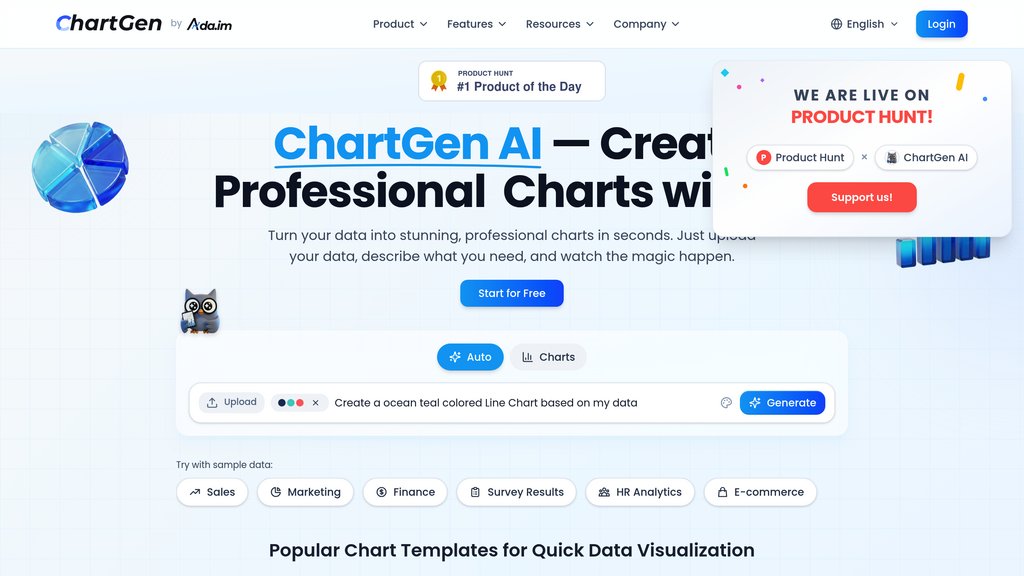
What is ChartGen AI?
ChartGen AI is an intelligent data visualization platform designed to simplify the process of converting raw data into professional, presentation-ready charts. Users can upload CSV or Excel files, connect live data sources, or paste data directly, then describe their visualization needs in plain English. The platform automatically analyzes the data structure, selects the most appropriate chart type, applies suitable aggregations, and generates polished visualizations in seconds. Built with advanced algorithms that understand data context, ChartGen AI removes the need for design expertise or coding knowledge, making professional data visualization accessible to business teams, analysts, and executives worldwide. The platform is backed by Ada.im, a comprehensive data analysis intelligent agent platform, enabling users to scale from simple chart creation to full reporting and dashboard capabilities.
Key Features
Natural Language Chart Generation
Describe visualization requirements in plain English and let the platform automatically determine the optimal chart type, field mappings, and data aggregations without requiring technical configuration or design skills.
Multiple Data Import Options
Support for CSV and Excel file uploads, direct data pasting, and live data source connections that automatically refresh charts as underlying data changes in real-time.
Comprehensive Chart Type Library
Nine professional visualization formats including bar charts, line graphs, pie charts, area charts, scatter plots, heatmaps, combo charts, waterfall charts, and funnel charts for diverse analytical needs.
Professional Design Templates
Twelve professional color themes inspired by leading consulting firms, customizable via built-in color picker, ensuring charts maintain consistent visual standards across reports and presentations.
Flexible Export and Sharing
Download charts in PNG, SVG, and PDF formats for direct use in presentations and reports, or publish to interactive dashboards for team collaboration and stakeholder access.
Enterprise-Grade Security
SOC 2 compliance, end-to-end encryption, HTTPS data transmission, and no permanent storage of uploaded files, ensuring sensitive business data remains protected and private.
Use Cases
- Financial Reporting : Transform quarterly financial data, revenue trends, and profit margin analysis into clear executive presentations, with CFOs reducing report preparation time by up to 75%.
- Marketing Campaign Analysis : Visualize campaign performance, channel attribution, ROI metrics, and conversion tracking across multiple advertising platforms to optimize spending and accelerate campaign reporting by 3x.
- Business Analytics and Dashboards : Create interactive performance dashboards that consolidate key metrics from disparate data sources, enabling teams to monitor operational performance and business health at a glance.
- Research and Academic Presentations : Convert survey results, statistical analyses, and research findings into professional visualizations suitable for academic papers, conferences, and institutional reports.
- Sales and E-Commerce Analysis : Break down sales by region, product, or channel; track customer trends; and visualize inventory metrics to inform strategic pricing and inventory decisions.
FAQs
ChartGen AI Alternatives
vizGPT
Conversational data visualization and analytics platform that lets users create interactive charts and dashboards through natural language or drag-and-drop tools.
VisActor
Comprehensive intelligent visualization platform focusing on narrative visualization and AI-driven data storytelling.
Chat2CSV
AI-powered platform that transforms CSV data into diverse charts through natural language commands, ensuring ease of use and strong data privacy.
Medallia
Enterprise experience management platform that captures every customer and employee signal across all channels and turns it into clear, prioritized actions.
Tableau
A leading visual analytics platform that empowers users to explore, analyze, and share data insights easily with AI-powered features and flexible deployment options.
Checkr
AI-powered background screening platform delivering fast, accurate, and compliant hiring checks with seamless integrations and superior candidate experience.
Energent.ai
Intelligent data analysis platform that processes multiple file types to deliver actionable insights through automated workflows and visual dashboards.
Bricks
AI-powered spreadsheet platform that simplifies data analysis, visualization, and reporting without requiring spreadsheet expertise.
Analytics of ChartGen AI Website
🇷🇺 RU: 9.78%
🇺🇸 US: 9.05%
🇸🇦 SA: 6.88%
🇮🇳 IN: 5.94%
🇬🇧 GB: 3.55%
Others: 64.8%