Scoop Analytics
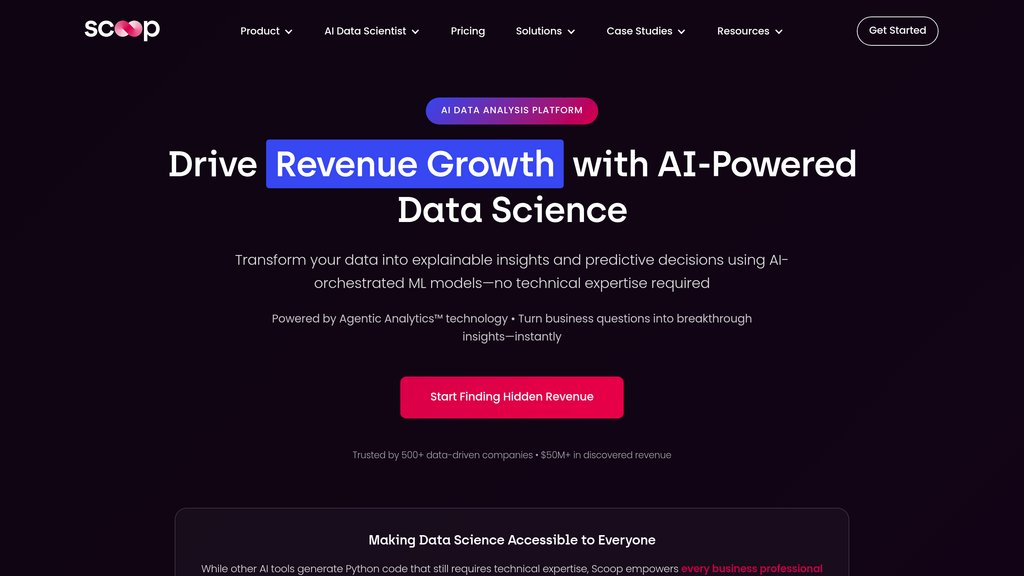
Business intelligence platform that transforms raw data into actionable insights through automated reporting and machine learning analysis.
Community:
Product Overview
What is Scoop Analytics?
Scoop Analytics is a comprehensive business intelligence platform designed specifically for non-technical business teams. The platform eliminates the need for SQL knowledge or data engineering expertise by providing automated data analysis, report generation, and predictive modeling capabilities. Scoop connects to various data sources including CRMs, marketing tools, and analytics platforms, then uses machine learning algorithms to identify patterns, predict outcomes, and generate presentation-ready reports. The platform features a spreadsheet-like interface that business professionals can easily navigate while accessing sophisticated analytics capabilities typically reserved for data scientists.
Key Features
Automated Report Generation
Creates presentation-ready reports and dashboards automatically from connected data sources without manual formatting or SQL queries.
Machine Learning Analytics
Built-in ML algorithms that identify hidden patterns, predict customer behavior, and surface actionable insights from business data.
Multi-Source Data Integration
Seamlessly connects to CRMs, marketing platforms, Google Analytics, and other business tools to provide unified data analysis.
Natural Language Querying
Ask business questions in plain English and receive comprehensive answers with supporting visualizations and data explanations.
Predictive Modeling
Identifies at-risk customers, predicts conversion likelihood, and forecasts business outcomes using advanced machine learning models.
Use Cases
- Marketing Campaign Analysis : Marketing teams analyze campaign performance, optimize spend allocation, and identify high-converting channels and audiences.
- Sales Pipeline Optimization : Sales organizations track deal velocity, identify bottlenecks, and predict which prospects are most likely to convert.
- Customer Churn Prevention : Revenue teams identify at-risk accounts early and implement proactive retention strategies based on predictive analytics.
- Revenue Operations Analysis : RevOps teams conduct comprehensive audits, track attribution across the funnel, and optimize revenue generation processes.
- Executive Reporting : Leadership teams create board-ready presentations with key metrics, trends, and strategic insights automatically generated from business data.
FAQs
Scoop Analytics Alternatives
15Five
A comprehensive performance management platform that drives employee engagement, retention, and performance through continuous feedback and manager enablement.
Rows
A modern spreadsheet platform that integrates AI-powered data analysis and automation with seamless business app connectivity.
Octane AI
Ecommerce-focused AI platform that personalizes shopping experiences through interactive quizzes, conversational marketing, and automated product recommendations.
GradeWiz
AI-powered grading assistant that automates student assessment, providing quick feedback and reducing grading time significantly.
Amplitude
Leading product analytics platform delivering real-time behavioral insights and AI-powered automation to optimize user engagement and growth.
SolarWinds
Comprehensive IT management platform providing network monitoring, infrastructure visibility, alerting, and reporting tools for scalable and unified IT operations.
Analytics of Scoop Analytics Website
🇺🇸 US: 58.76%
🇮🇳 IN: 21.41%
🇬🇧 GB: 9.07%
🇵🇰 PK: 4.87%
🇦🇺 AU: 4.41%
Others: 1.47%
