
RowSpeak
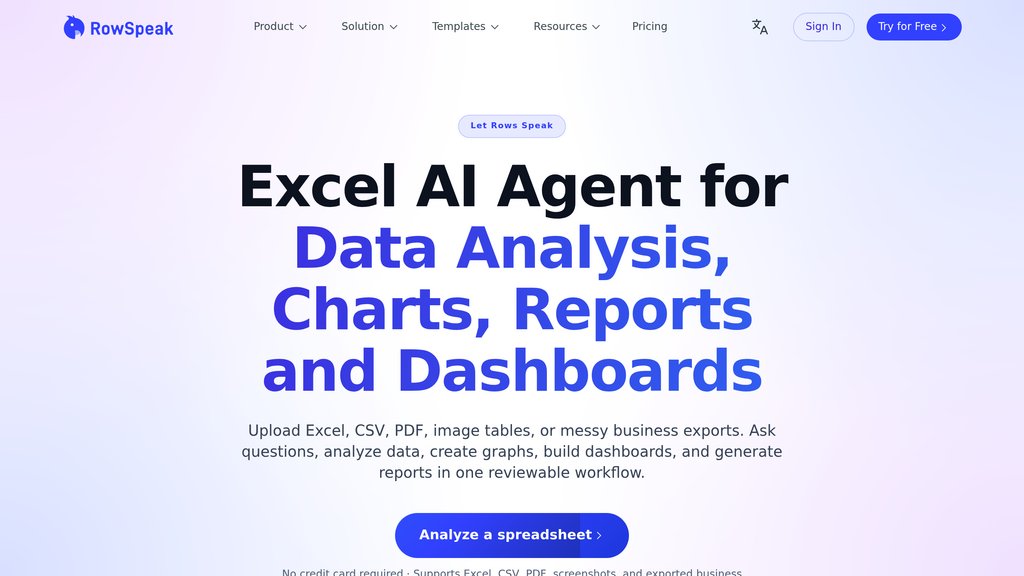
Excel-focused data agent that turns messy spreadsheets, CSVs, PDFs, and image tables into charts, dashboards, and business-ready reports through plain-language queries.
Community:

Product Overview
What is RowSpeak?
RowSpeak is a spreadsheet analysis platform built for business teams that work with Excel exports, CSV files, PDF tables, and image-based data. Users upload a file, ask questions in plain English, and receive cleaned data, charts, dashboards, and report-ready summaries — without writing formulas, SQL, or setting up a BI stack. The platform is designed around reviewable, repeatable workflows, so teams can inspect assumptions, refine outputs, and reuse the same analysis process week over week. RowSpeak targets finance, sales, marketing, operations, and e-commerce teams that need faster answers from the spreadsheet files they already have.
Key Features
Multi-Format File Support
Accepts Excel, CSV, PDF tables, image-based tables, and pasted data — including messy exports with inconsistent headers, missing values, and mixed formats.
Natural Language Data Analysis
Ask business questions in plain English to identify trends, detect anomalies, compare segments, and explain data changes without formulas or pivot tables.
Chart and Dashboard Generation
Automatically generates bar charts, line charts, pie charts, and KPI dashboards from uploaded spreadsheet data, with options to adjust chart type and data source.
Report Generation
Produces variance notes, management summaries, and decision briefs from raw business files — structured outputs ready to share with teams or leadership.
Reviewable and Correctable Outputs
Users can inspect AI-generated logic, fix field mappings, adjust metric assumptions, and refine results before exporting — keeping human judgment in the loop.
Repeatable Workflow Design
Supports recurring analysis tasks by letting teams reuse cleaned data structures and reporting workflows instead of rebuilding the process from scratch each time.
Use Cases
- Finance Reporting : Finance teams can run variance analysis, build management reports, and generate recurring KPI packs from raw Excel exports without manual reformatting.
- Marketing Performance Analysis : Marketing teams can upload Meta, Google, or CRM exports and instantly surface ROAS, CAC, and campaign performance insights without waiting on data teams.
- Sales and Revenue Operations : Sales ops teams can analyze pipeline exports, win rates, and segment performance to produce presentation-ready dashboards directly from spreadsheet files.
- E-commerce Operations : E-commerce teams can process platform exports to understand GMV, refunds, ad spend, and channel performance with minimal manual data prep.
- Agency Client Reporting : Agencies can turn client-exported spreadsheets into polished reports without rebuilding each analysis manually for every account.
FAQs
RowSpeak Alternatives

Sourcetable
AI-powered spreadsheet platform that automates data analysis, visualization, and workflow integration with real-time connectivity to 100+ data sources.

Microsoft Power BI
A comprehensive business analytics platform that enables data visualization, interactive reporting, and data-driven decision-making across diverse industries.

Tableau
A leading visual analytics platform that empowers users to explore, analyze, and share data insights easily with AI-powered features and flexible deployment options.

Bricks
AI-powered spreadsheet platform that simplifies data analysis, visualization, and reporting without requiring spreadsheet expertise.

Datarails
Comprehensive FP&A platform that integrates with Excel, automates data consolidation, reporting, and planning, empowering finance teams with real-time insights and AI-driven analysis.

Coefficient
A no-code platform that seamlessly connects spreadsheets to various business systems, enabling real-time data integration, automation, and AI-powered analysis.

ChartGen AI
Data visualization platform that transforms CSV and Excel files into professional charts through natural language descriptions, supporting nine chart types with enterprise-grade security.

Graphy
AI-powered data visualization platform enabling fast creation of beautiful, interactive graphs and dashboards with seamless data integration.