Lightdash
Open-source BI platform that transforms dbt projects into interactive, self-serve analytics for teams and businesses.
Community:
Product Overview
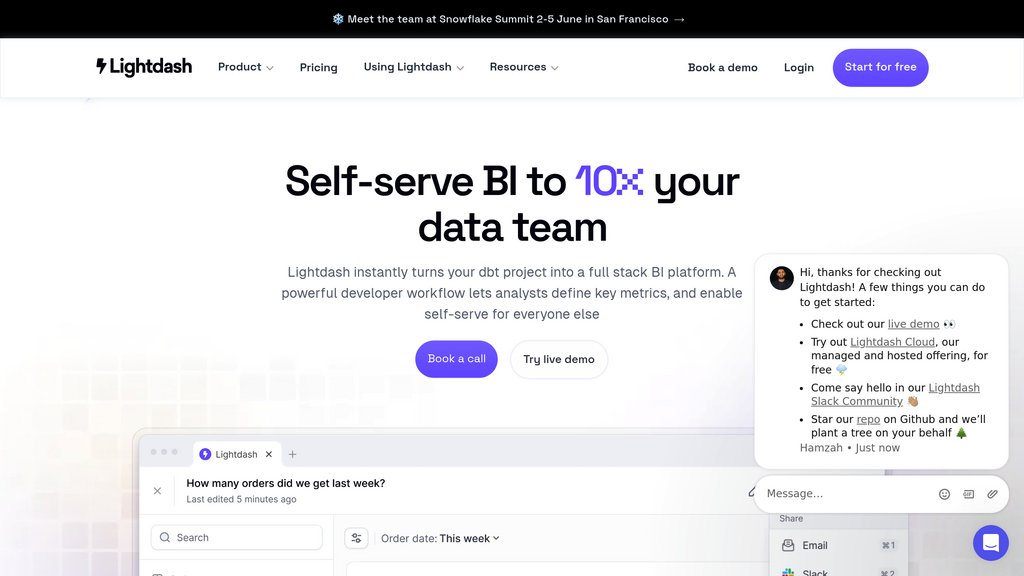
What is Lightdash?
Lightdash is a modern business intelligence tool designed to seamlessly integrate with dbt projects, enabling data teams to build interactive dashboards and reports that empower the entire organization to explore data independently. It offers a developer-friendly workflow with CLI tools, version control compatibility, and staging environments, combined with an intuitive UI for non-technical users to perform data exploration without SQL skills. Lightdash supports embedding analytics into applications, scheduling reports, and collaboration features like comments and annotations, all while maintaining strong security and governance controls.
Key Features
Deep dbt Integration
Leverages your existing dbt project to define business logic and metrics, ensuring consistency and eliminating redundant transformations.
Self-Serve Analytics
Enables non-technical users to explore data, create visualizations, and interact with dashboards without needing SQL knowledge.
Collaborative Environment
Supports sharing dashboards, commenting, annotations, and role-based access control to foster teamwork and secure data governance.
Powerful SQL Runner & Developer Tools
Provides a full-featured SQL editor, CLI tools, staging environments, and CI/CD integration for data developers to manage and validate analytics workflows.
Customizable Dashboards & Visualizations
Offers configurable chart types, custom color schemes, and the ability to embed analytics natively into applications.
Automated Reporting & Alerts
Schedule report deliveries via Slack or email and set threshold alerts to keep teams informed of key metric changes.
Use Cases
- Data Team Enablement : Analysts and engineers can streamline workflows by defining metrics once in dbt and enabling business users to self-serve insights.
- Business User Analytics : Non-technical stakeholders access and explore data through interactive dashboards, driving data-informed decisions across departments.
- Embedded Analytics : Product teams can embed customizable, secure dashboards directly into customer-facing applications to deliver real-time insights.
- Collaborative Data Exploration : Teams collaborate on data projects with shared dashboards, comments, and version control, ensuring alignment and transparency.
- Automated Reporting : Schedule regular data reports and alerts to Slack or email, keeping teams updated without manual intervention.
FAQs
Lightdash Alternatives
Draxlr
No-code BI platform for SQL data visualization, dashboard building, alerting, and embedding with AI-powered insights.
Polymer Search
AI-driven embedded analytics platform offering seamless integration, AI-assisted data storytelling, and customizable dashboards.
Snow Software
Comprehensive technology intelligence platform delivering software asset management, SaaS management, and IT asset insights with AI-powered automation.
Cube
Universal semantic layer platform that unifies data models and delivers consistent metrics across BI tools, APIs, and LLM applications.
Heap
Comprehensive digital insights platform offering automatic, retroactive product analytics with advanced data science and multi-device tracking.
Visible.vc
A comprehensive investor relationship platform that streamlines fundraising, stakeholder communication, and portfolio management for startups and venture capital firms.
OWOX BI
A scalable data democratization and marketing analytics platform that centralizes business data, automates reporting, and empowers users with real-time, reliable insights.
Databox
Self-service business intelligence platform that centralizes data from 130+ integrations into real-time dashboards, reports, and automated insights.
Analytics of Lightdash Website
🇮🇳 IN: 35.17%
🇺🇸 US: 18.22%
🇬🇧 GB: 7.89%
🇩🇪 DE: 4.46%
🇧🇷 BR: 3.75%
Others: 30.51%