Napkin AI
AI-powered platform that transforms text into professional-quality visuals like infographics, flowcharts, and diagrams with ease.
Community:
InsForge
An agent-native alternative to AWS. Run full-stack apps end to end via CLI and skills
Product Overview
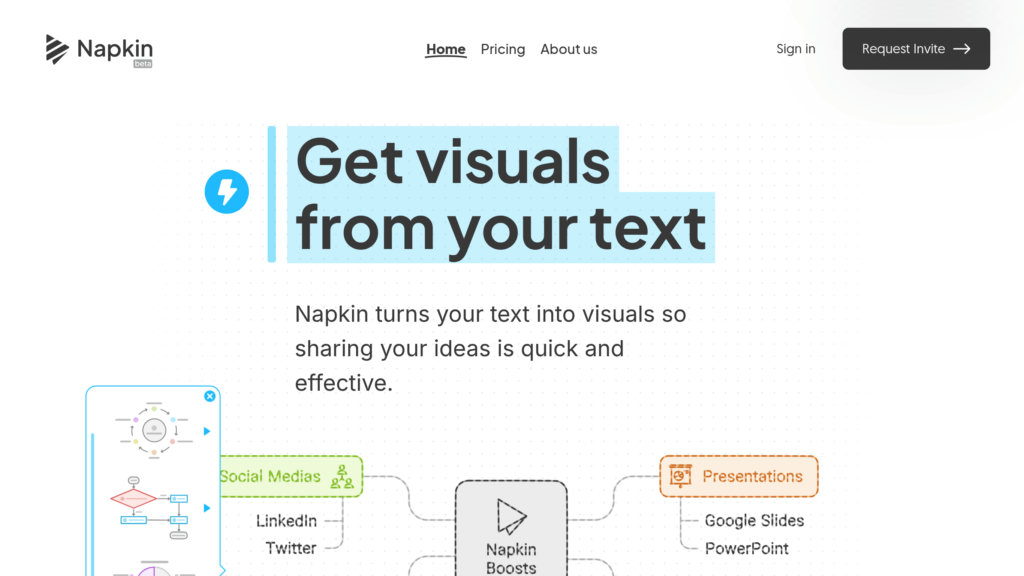
What is Napkin AI?
Napkin AI is an advanced artificial intelligence tool designed to convert textual content into clear, visually engaging graphics such as infographics, charts, flowcharts, and diagrams. It leverages natural language processing and machine learning to understand user input and automatically generate polished visuals that can be customized to fit branding and style preferences. The platform streamlines the design process for marketers, educators, content creators, and business professionals by eliminating the need for advanced graphic design skills while enabling quick, collaborative, and consistent visual communication.
Key Features
AI-Powered Visual Generation
Automatically transforms text or data into professional infographics, charts, and diagrams, saving time and effort.
Customizable Templates and Styles
Offers a wide range of templates and style options, including brand color and font integration, to maintain visual consistency.
Multi-Format Export
Supports exporting visuals in PNG, SVG, and PDF formats for versatile use across presentations, reports, and social media.
Collaborative Editing and Sharing
Enables real-time collaboration and easy sharing with teams, enhancing productivity and feedback cycles.
Seamless Integration
Integrates with popular productivity tools like Notion, Trello, and Google Drive to fit smoothly into existing workflows.
Dynamic Knowledge Graph and AI Idea Linking
Builds visual knowledge graphs that connect ideas and notes intelligently, helping users discover relationships and develop concepts.
Use Cases
- Marketing and Content Creation : Create engaging infographics, social media visuals, and campaign materials quickly without design expertise.
- Business Process Visualization : Generate flowcharts, organizational charts, and process diagrams to improve communication and planning.
- Education and Training : Develop clear educational diagrams and visual aids to simplify complex topics for students and trainees.
- Idea Management and Brainstorming : Capture, organize, and connect ideas visually to enhance creativity and project development.
- Report and Presentation Enhancement : Transform raw data and text into compelling visuals that make reports and presentations more impactful.
FAQs
Napkin AI Alternatives
Asana
A scalable work management platform that connects company-wide goals to daily tasks, enabling teams to plan, track, and manage work efficiently.
Miro
AI-powered visual collaboration platform offering an infinite canvas for teams to ideate, plan, and innovate together seamlessly.
Mermaid
Text-to-diagram platform that turns plain language or Markdown-style code into clean, shareable visuals in seconds, built by the creators of the open-source Mermaid.js.
Lucidchart
Cloud-based intelligent diagramming platform enabling real-time collaboration, data visualization, and automation for diverse diagram types.
Vidnoz AI
AI-powered video creation platform offering fast, easy generation of videos with avatars, voices, templates, and advanced customization.
VDraw AI
AI-powered platform that transforms text, documents, and videos into professional infographics and flowcharts with easy customization and multi-format export.
EdrawMax
Comprehensive all-in-one diagramming software offering 280+ diagram types with AI-powered automation and extensive collaboration features.
Edraw.AI
AI-powered all-in-one visual collaboration platform offering 210+ diagram types, real-time teamwork, and intelligent content generation.
Analytics of Napkin AI Website
🇮🇳 IN: 6.95%
🇧🇷 BR: 5.49%
🇺🇸 US: 5.38%
🇨🇴 CO: 4.75%
🇰🇷 KR: 3.99%
Others: 73.44%