Lucidchart
Cloud-based intelligent diagramming platform enabling real-time collaboration, data visualization, and automation for diverse diagram types.
Community:
InsForge
An agent-native alternative to AWS. Run full-stack apps end to end via CLI and skills
Product Overview
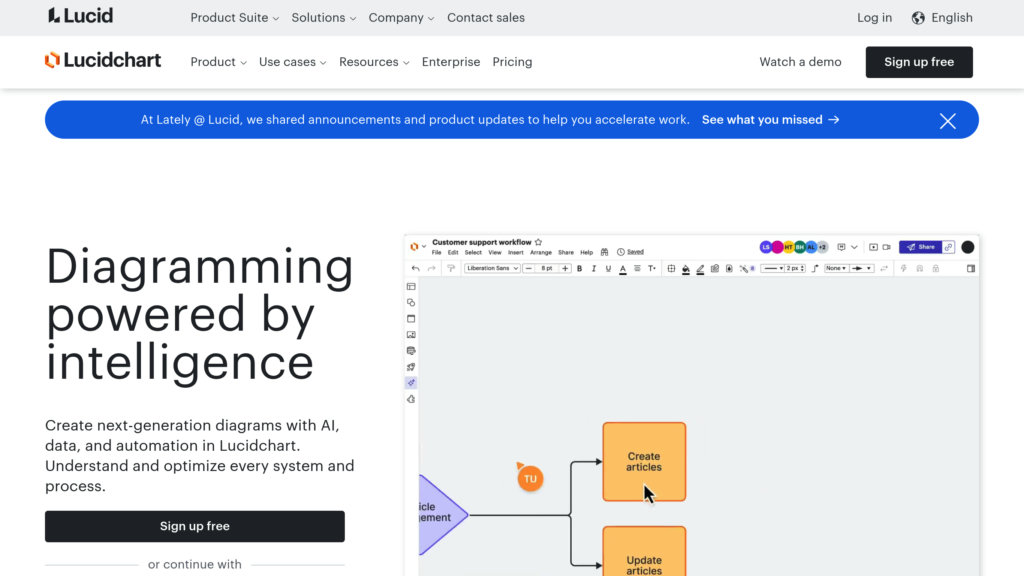
What is Lucidchart?
Lucidchart is a versatile cloud-based diagramming tool designed to help teams visualize complex systems, processes, and organizational structures through interactive and intelligent diagrams. It supports a wide range of diagram types including flowcharts, org charts, network diagrams, UML, ERDs, and more. Lucidchart integrates AI-driven features, data linking, and automation to streamline diagram creation and updates, while enabling seamless real-time collaboration across devices and platforms. Its extensive template library and customizable shape libraries make it suitable for technical professionals, business leaders, and creative teams aiming to clarify complexity and improve decision-making.
Key Features
AI-Powered Diagram Generation
Leverage AI to automatically generate, enhance, and summarize diagrams, reducing manual effort and accelerating workflow.
Real-Time Collaboration
Collaborate simultaneously with team members using in-editor chat, commenting, and collaborative cursors for immediate feedback.
Data Linking and Automation
Connect diagrams to live data sources like spreadsheets and databases to visualize real-time metrics and automate updates.
Extensive Template and Shape Libraries
Access hundreds of customizable templates and shape libraries covering UML, ERD, network icons, org charts, and more.
Version Control and Revision History
Track changes with detailed version history and easily revert to previous diagram states to manage edits effectively.
Integrations with Popular Tools
Seamlessly integrate with Google Workspace, Microsoft Office, Slack, Jira, Confluence, and other enterprise applications.
Use Cases
- Process Mapping and Optimization : Create detailed process maps and flowcharts to identify inefficiencies, align teams, and improve operational workflows.
- Organizational Planning : Build dynamic org charts with data overlays to visualize team structures, workloads, and resource allocation.
- Technical System Documentation : Design network diagrams, software architecture, and system workflows to enhance clarity and communication among technical teams.
- Project Management Visualization : Use diagrams to plan projects, track progress, and facilitate Agile and Scrum methodologies with visual boards.
- Data-Driven Decision Making : Integrate live data into diagrams for real-time insights, enabling informed decisions and strategic planning.
FAQs
Lucidchart Alternatives
Mermaid Chart
A cutting-edge diagramming tool that transforms markdown-style text into visual diagrams, enhancing collaboration and workflow management.
Miro
AI-powered visual collaboration platform offering an infinite canvas for teams to ideate, plan, and innovate together seamlessly.
Boardmix
AI-powered online collaborative whiteboard platform designed to enhance team creativity, communication, and productivity through real-time collaboration and versatile visual tools.
GanttPRO
Online Gantt chart software for professional project planning, scheduling, team collaboration, and resource management.
博思白板
Cloud-based collaborative whiteboard platform with integrated AI capabilities for team visualization and real-time collaboration.
HowsThisGoing
AI-powered project management assistant that automates status updates, generates summaries, and provides real-time team insights via Slack integration.
Fizzy
A streamlined kanban-style project management platform designed for tracking bugs, issues, ideas, and lightweight workflows with simplicity and speed.
Cloudairy
A versatile collaborative workspace combining diagramming, mind mapping, and project management tools with AI enhancements to streamline team workflows.
Analytics of Lucidchart Website
🇺🇸 US: 16.04%
🇲🇽 MX: 6.74%
🇨🇴 CO: 6.33%
🇧🇷 BR: 5.13%
🇵🇪 PE: 3.77%
Others: 61.98%