Mokkup.ai
Cloud-based dashboard wireframing tool designed for data analysts, BI developers, and business teams to quickly prototype and collaborate on business intelligence dashboards.
Community:
InsForge
An agent-native alternative to AWS. Run full-stack apps end to end via CLI and skills
Product Overview
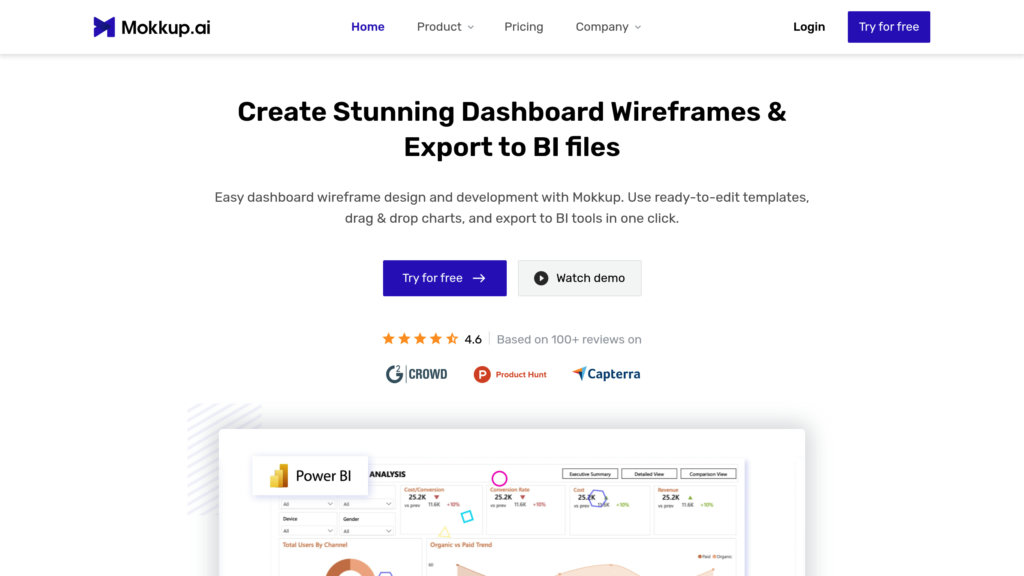
What is Mokkup.ai?
Mokkup.ai is a specialized online platform that streamlines the creation of high-fidelity dashboard wireframes without requiring design expertise or coding skills. It caters primarily to data analysts, BI developers, and business stakeholders by offering a rich library of pre-built templates and drag-and-drop elements tailored for business intelligence projects. The platform enhances collaboration through interactive comments and feedback, and supports seamless export of wireframes as templates directly into Tableau and Power BI, accelerating the dashboard development lifecycle.
Key Features
Extensive Template Library
Offers 100+ industry-standard dashboard templates and 20+ customizable drag-and-drop elements for rapid prototyping.
Seamless Export to BI Tools
One-click export feature to Tableau and Power BI, enabling smooth transition from wireframe to live dashboard.
Collaborative Workspace
Supports real-time feedback, comments, and discussions to improve teamwork and stakeholder engagement.
User-Friendly Interface
Intuitive drag-and-drop design environment that requires no prior design or coding experience.
Role and Permission Management
Allows easy management of team members, roles, and access permissions within projects.
Use Cases
- Dashboard Prototyping : Create detailed wireframes of BI dashboards to visualize data insights before development.
- Stakeholder Communication : Use interactive mockups to gather feedback and secure approvals from business users and management.
- BI Project Planning : Define dashboard requirements clearly to guide developers and reduce rework during implementation.
- Cross-Functional Collaboration : Facilitate collaboration between data analysts, developers, and business teams through shared workspaces.
- Training and Onboarding : Use dashboard prototypes as educational tools to familiarize teams with upcoming BI solutions.
FAQs
Mokkup.ai Alternatives
Retable
No-code online spreadsheet and database platform that transforms spreadsheets into smart, collaborative data management apps with AI and automation.
Baserow
Open-source no-code platform for building collaborative databases and applications with flexible deployment options and enterprise-grade compliance.
SmartSuite
Comprehensive work management platform that unifies projects, processes, and workflows in a single customizable solution.
monday.com
A versatile Work OS platform enabling customizable workflow management, team collaboration, and project tracking across industries.
Workato
Enterprise integration and automation platform connecting applications, data, and workflows with AI-powered capabilities.
Fibery
A highly customizable no-code platform that unifies product management, knowledge management, and team collaboration with powerful data connectivity and AI-enhanced insights.
Stacker
No-code platform that transforms spreadsheets into custom business apps, streamlining workflows and data management.
BrainGrid
Product planning platform that transforms ideas into structured specifications and task breakdowns for coding agents to build reliable software.
Analytics of Mokkup.ai Website
🇮🇳 IN: 25.47%
🇺🇸 US: 12.66%
🇻🇳 VN: 7.05%
🇸🇳 SN: 6.69%
🇳🇬 NG: 3.88%
Others: 44.25%