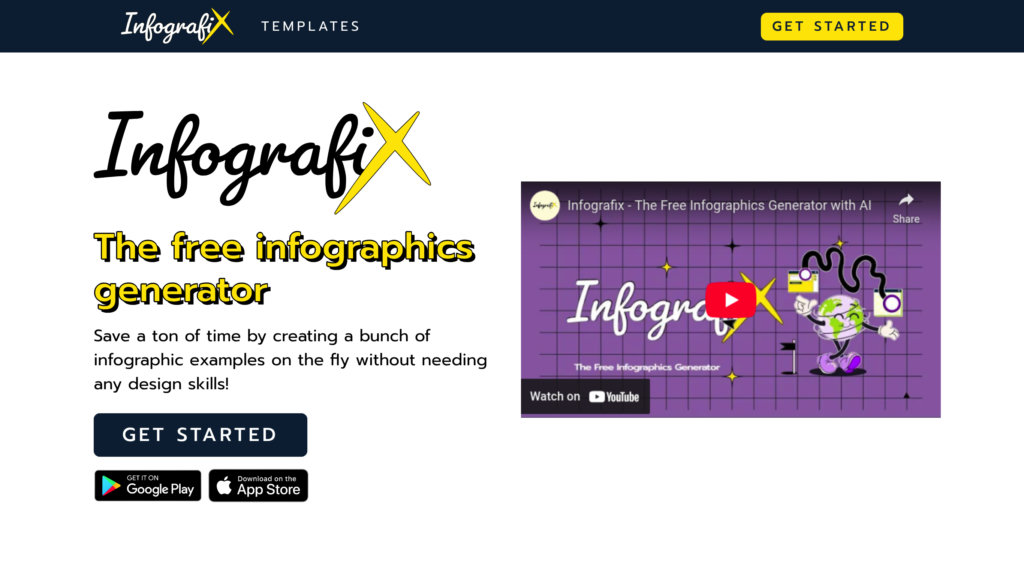
Infografix
AI-powered platform for creating interactive, responsive, and visually compelling infographics without design skills.
Product Overview
What is Infografix?
Infografix is an innovative AI-driven platform that simplifies the creation of a wide range of infographics, including timelines, charts, process maps, and interactive visuals. It leverages generative AI (Azure AI) to interpret user prompts and instantly produce professional-quality infographics. The platform supports customization through various templates, color palettes, and fonts, enabling users to craft tailored visual content for diverse purposes such as marketing, education, and data visualization.
Key Features
AI-Driven Content Generation
Utilizes advanced AI to interpret text prompts and automatically generate diverse infographic types, saving time and effort.
Interactive & Responsive Designs
Creates infographics that are adaptable and engaging across different devices and platforms, enhancing user interaction.
Rich Customization Options
Offers a variety of templates, color schemes, and over 1,500 Google Fonts to personalize visuals and align with branding.
Multi-Format Export
Supports exporting in PNG, JPG, SVG, and PDF formats for versatile sharing and integration into presentations.
Ease of Use
Designed with a user-friendly interface that requires no prior design experience, enabling quick creation of professional infographics.
Use Cases
- Data Visualization : Transform complex data into engaging visual stories for reports, dashboards, and presentations.
- Educational Content : Create interactive timelines, diagrams, and charts to enhance learning materials and academic projects.
- Marketing & Social Media : Design eye-catching infographics for social media campaigns, blog posts, and promotional materials.
- Business Reports : Generate professional visuals for business reports, strategic plans, and stakeholder presentations.
- Interactive Web Content : Develop engaging, interactive infographics for websites and digital platforms to improve user engagement.
FAQs
Infografix Alternatives
Gamma AI
AI-powered platform for creating engaging presentations, documents, and webpages with effortless design and collaboration tools.
PPT.AI
Professional presentation creation platform that transforms text, documents, and multimedia content into polished slides within minutes.
潮际好麦
AI-powered platform revolutionizing shoe and apparel design with flexible creativity and streamlined fashion manufacturing workflows.
墨刀 AIPPT
Intelligent presentation creation platform that transforms topics and documents into professional slide decks within seconds.
Madeonverse
Creative platform enabling users to design personalized visual blogs, mini-sites, and mixed media art based on their music taste.
TeeAI
AI-powered platform for creating unique, customizable t-shirt designs quickly and easily.
Analytics of Infografix Website
🇮🇳 IN: 8.14%
🇭🇰 HK: 7.32%
🇺🇸 US: 7.14%
🇩🇪 DE: 5.37%
🇳🇬 NG: 4.82%
Others: 67.2%
