Gantt Chart AI
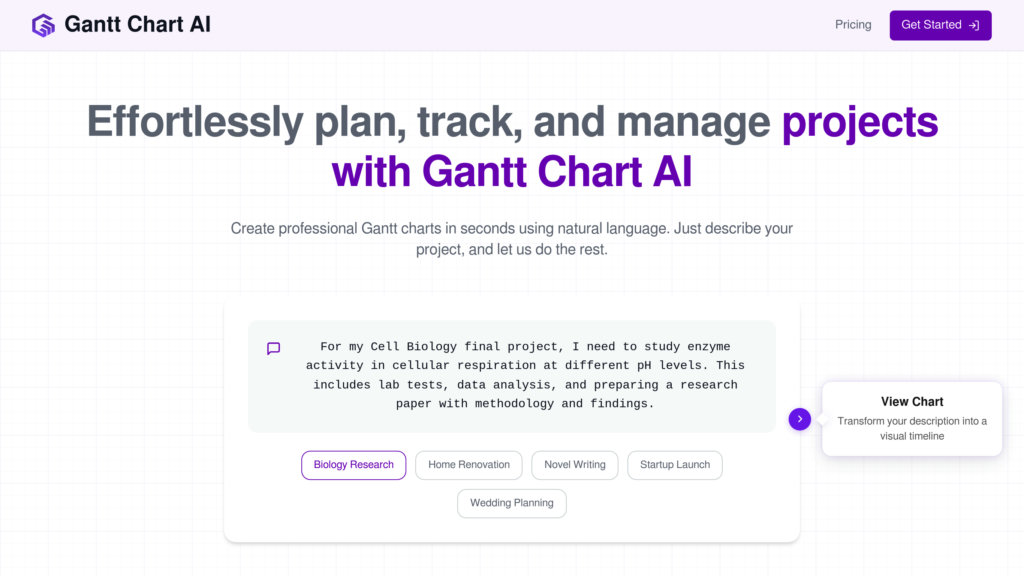
AI-powered online tool that creates professional Gantt charts instantly from natural language project descriptions.
Community:
Product Overview
What is Gantt Chart AI?
Gantt Chart AI is a user-friendly project management solution that leverages artificial intelligence to automate the creation of detailed Gantt charts. Users simply describe their project in plain English, and the AI generates a complete timeline with tasks, milestones, dependencies, and durations within minutes. The platform integrates seamlessly with Google Sheets for easy editing and offers export options to Excel, enabling flexible project tracking and collaboration. Designed for professionals across industries, it simplifies complex project scheduling without requiring expert knowledge.
Key Features
Natural Language Project Input
Create comprehensive project timelines by describing your project in simple English, eliminating manual chart setup.
Automatic Task and Milestone Generation
AI identifies key tasks, milestones, and dependencies, generating a detailed and structured project schedule quickly.
Google Sheets Integration
Edit and customize your Gantt charts directly in Google Sheets for familiar, flexible project management.
Export and Sharing Options
Export charts to Excel format and share them easily with team members or stakeholders.
Intuitive and Minimal Learning Curve
Designed with a straightforward interface, enabling users to plan projects efficiently without complex workflows.
Use Cases
- Construction Project Management : Coordinate contractors, phases, and timelines with clear visual schedules.
- Software Development Planning : Manage sprints, dependencies, and release milestones effectively.
- Event Planning : Organize logistics and timelines for seamless event execution.
- Product Launch Coordination : Align marketing, manufacturing, and distribution schedules.
- Research Project Tracking : Monitor experiments and study phases with clear task dependencies.
FAQs
Gantt Chart AI Alternatives
SkyPlanner APS
Cloud-based production scheduling software that automates and optimizes manufacturing plans with fast, visual tools and seamless ERP integration.
Stepsize AI
Automated operational intelligence platform that transforms issue tracker data into clear, actionable updates and insights for engineering teams.
Merlin AI
AI-powered construction management platform delivering real-time insights, workflow automation, and financial oversight to optimize project outcomes.
Constructable
Integrated construction management platform combining RFI tracking, submittal management, and financial oversight in a single intuitive solution designed for mid-size contractors.
TimeHero
Automated work and task planning software that schedules tasks around your calendar and priorities to maximize productivity.
Routerra
Fast and intuitive route planning software designed to optimize delivery and mobile workforce routes efficiently.
Cartage
Managed logistics service that coordinates freight directly between shippers and carriers, eliminating traditional broker markups.
Lanceboard
AI-powered freelance platform that matches your task tickets instantly with the most suitable freelancers.
Analytics of Gantt Chart AI Website
🇳🇬 NG: 12.7%
🇺🇸 US: 10.85%
🇮🇳 IN: 7.5%
🇸🇦 SA: 5.97%
🇮🇩 ID: 5.43%
Others: 57.55%
