Draxlr
No-code BI platform for SQL data visualization, dashboard building, alerting, and embedding with AI-powered insights.
Community:
Product Overview
What is Draxlr?
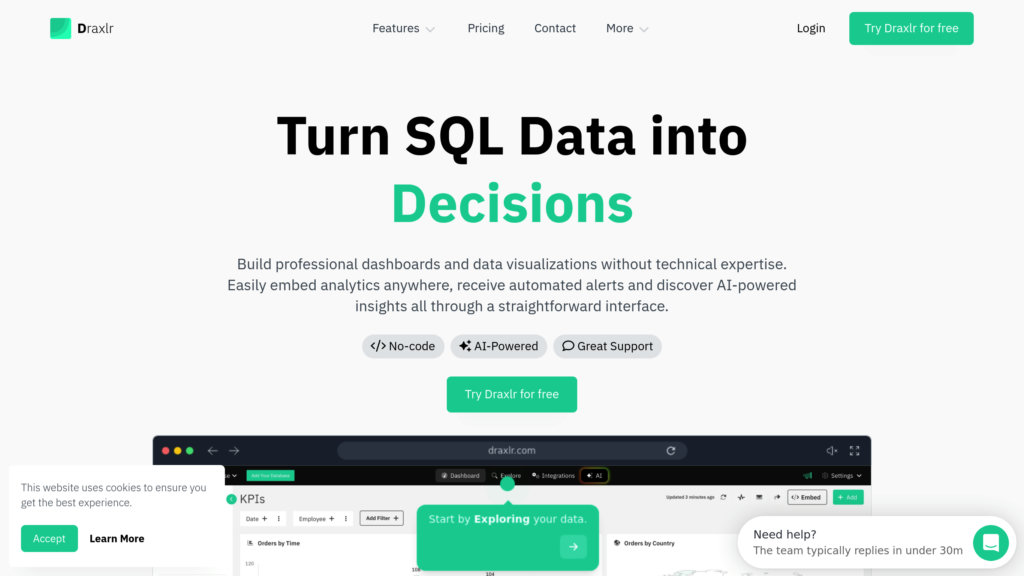
Draxlr is a user-friendly business intelligence platform designed to help users explore, visualize, and monitor SQL database data without coding. It offers a drag-and-drop query builder, multiple chart types, customizable dashboards, and real-time alerts via email or Slack. Draxlr supports embedding interactive dashboards into apps or websites, enabling multi-tenant and white-label capabilities. With AI-powered query generation and insights, Draxlr empowers teams to make data-driven decisions efficiently while reducing reliance on developers. It is cost-effective and suitable for both technical and non-technical users.
Key Features
No-Code Query Builder
Build complex SQL queries visually without writing code, with the option to switch to raw SQL editing.
Customizable Dashboards
Create and tailor dashboards with diverse chart types, filters, and real-time data refresh to track key metrics.
Automated Alerts
Set up notifications for critical data changes or thresholds via email and Slack to stay informed instantly.
Embed Interactive Dashboards
Easily embed responsive, white-labeled dashboards into customer-facing apps or websites with multi-tenant support.
AI-Powered Insights
Leverage AI to generate SQL queries and uncover actionable insights from your data quickly.
Flexible Sharing and Export
Share dashboards via URLs, export data in CSV/Excel formats, and download visuals for reporting.
Use Cases
- Business Data Analysis : Non-technical users can explore and analyze SQL data independently to answer business questions.
- Team and Department Dashboards : Build focused dashboards to monitor KPIs for different teams or business units with customized views.
- Real-Time Monitoring and Alerts : Track critical metrics continuously and receive immediate alerts on significant data changes.
- Customer-Facing Analytics : Embed dashboards into applications to provide clients with contextual, interactive data insights.
- Data Sharing and Reporting : Easily share insights with stakeholders and export data for presentations or further analysis.
FAQs
Draxlr Alternatives
OWOX BI
A scalable data democratization and marketing analytics platform that centralizes business data, automates reporting, and empowers users with real-time, reliable insights.
Visible.vc
A comprehensive investor relationship platform that streamlines fundraising, stakeholder communication, and portfolio management for startups and venture capital firms.
Heap
Comprehensive digital insights platform offering automatic, retroactive product analytics with advanced data science and multi-device tracking.
Simple Analytics
Privacy-first, cookieless web analytics platform offering easy-to-understand insights with GDPR compliance and AI-powered interaction.
Fullstory
Digital Experience Intelligence platform that captures and analyzes user behavior to optimize digital products and increase conversions.
Snow Software
Comprehensive technology intelligence platform delivering software asset management, SaaS management, and IT asset insights with AI-powered automation.
Superads
AI-powered creative analytics platform delivering fast, actionable ad insights across Meta, TikTok, and LinkedIn with interactive dashboards and AI copilot.
Zefi AI
AI-driven customer feedback analytics platform that centralizes, categorizes, and analyzes user feedback to generate actionable insights for product and customer experience teams.
Analytics of Draxlr Website
🇺🇸 US: 30.46%
🇮🇳 IN: 9.61%
🇬🇧 GB: 4.16%
🇨🇦 CA: 3.85%
🇦🇺 AU: 2.71%
Others: 49.2%
