ChartDB
Open-source, web-based database diagramming tool enabling instant schema visualization, editing, and AI-powered export.
Community:
InsForge
An agent-native alternative to AWS. Run full-stack apps end to end via CLI and skills
Product Overview
What is ChartDB?
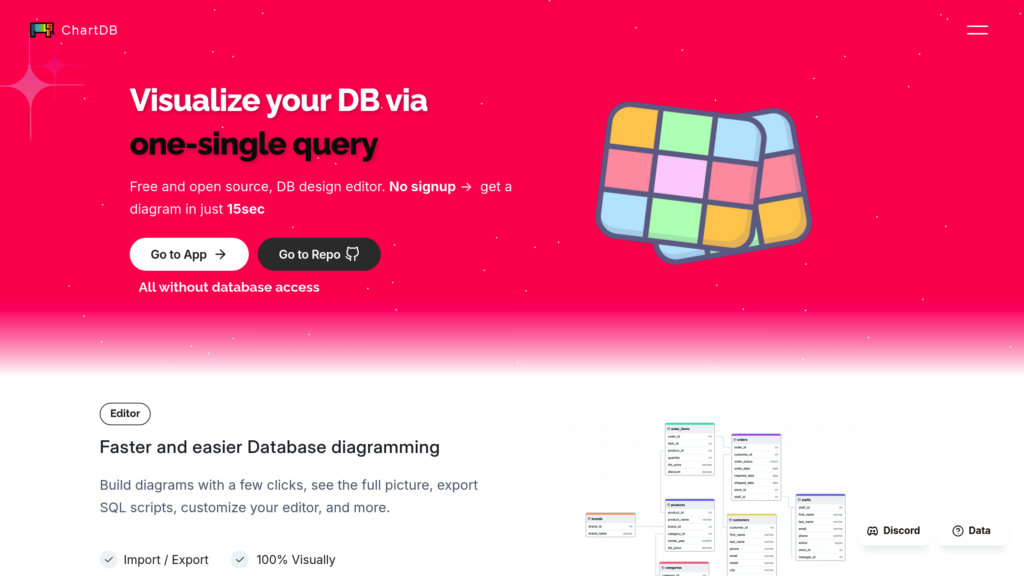
ChartDB is a powerful, free, and open-source database visualization and design platform that allows users to quickly import their database schema using a single query and generate clear, customizable ER diagrams. It supports a wide range of popular relational and analytical databases such as PostgreSQL, MySQL, SQLite, SQL Server, MariaDB, ClickHouse, and CockroachDB. ChartDB facilitates schema editing, relationship management, and offers AI-assisted export of SQL DDL scripts tailored to multiple SQL dialects, simplifying database migration and documentation workflows. Designed for developers, data analysts, and engineers, ChartDB can be used both as a cloud service or self-hosted solution, emphasizing ease of use, collaboration, and extensibility.
Key Features
Instant Schema Import
Retrieve and visualize your entire database schema instantly with a single smart query, supporting multiple database types.
AI-Powered SQL Export
Generate accurate DDL scripts in various SQL dialects for easy database migration and deployment.
Interactive Diagram Editor
Customize ER diagrams with features like undo/redo, table and relationship management, layouts, colors, and annotations.
Wide Database Support
Compatible with major relational and analytical databases including PostgreSQL, MySQL, SQLite, SQL Server, MariaDB, ClickHouse, and CockroachDB.
Open-Source and Self-Hosting
Fully open-source with options to run locally or on your own infrastructure, ensuring data privacy and customization.
Easy Sharing and Collaboration
Export diagrams as images, JSON, DBML, or SQL scripts to share visually appealing and precise database documentation.
Use Cases
- Database Schema Visualization : Quickly understand complex database structures through clear, interactive ER diagrams.
- Database Migration : Leverage AI-powered exports to generate DDL scripts for migrating databases across different SQL dialects.
- Schema Design and Editing : Modify and refine database schemas interactively, supporting development and maintenance tasks.
- Documentation and Collaboration : Create and share comprehensive database diagrams for team communication and project documentation.
- Self-Hosted Database Management : Deploy ChartDB on-premises to maintain full control over database visualization and security.
FAQs
ChartDB Alternatives
PicDoc
Text-to-visual conversion platform that transforms written content into professional charts, diagrams, and infographics with intelligent editing capabilities.
GitDiagram
Transform GitHub repositories into interactive diagrams for quick visualization and understanding of code structures.
CodetoFlow
AI-powered tool that converts code into interactive flowcharts to simplify complex logic and enhance code understanding.
Sketch2Scheme
AI-powered tool that converts hand-drawn flowcharts and diagrams into neatly arranged digital schemes with editable outputs.
Edraw.AI
AI-powered all-in-one visual collaboration platform offering 210+ diagram types, real-time teamwork, and intelligent content generation.
EdrawMax
Comprehensive all-in-one diagramming software offering 280+ diagram types with AI-powered automation and extensive collaboration features.
VDraw AI
AI-powered platform that transforms text, documents, and videos into professional infographics and flowcharts with easy customization and multi-format export.
Mermaid
Text-to-diagram platform that turns plain language or Markdown-style code into clean, shareable visuals in seconds, built by the creators of the open-source Mermaid.js.
Analytics of ChartDB Website
🇺🇸 US: 5.98%
🇮🇳 IN: 5.14%
🇪🇸 ES: 5.08%
🇷🇺 RU: 3.71%
🇮🇩 ID: 3.55%
Others: 76.53%