GitDiagram
Transform GitHub repositories into interactive diagrams for quick visualization and understanding of code structures.
Community:
InsForge
An agent-native alternative to AWS. Run full-stack apps end to end via CLI and skills
Product Overview
What is GitDiagram?
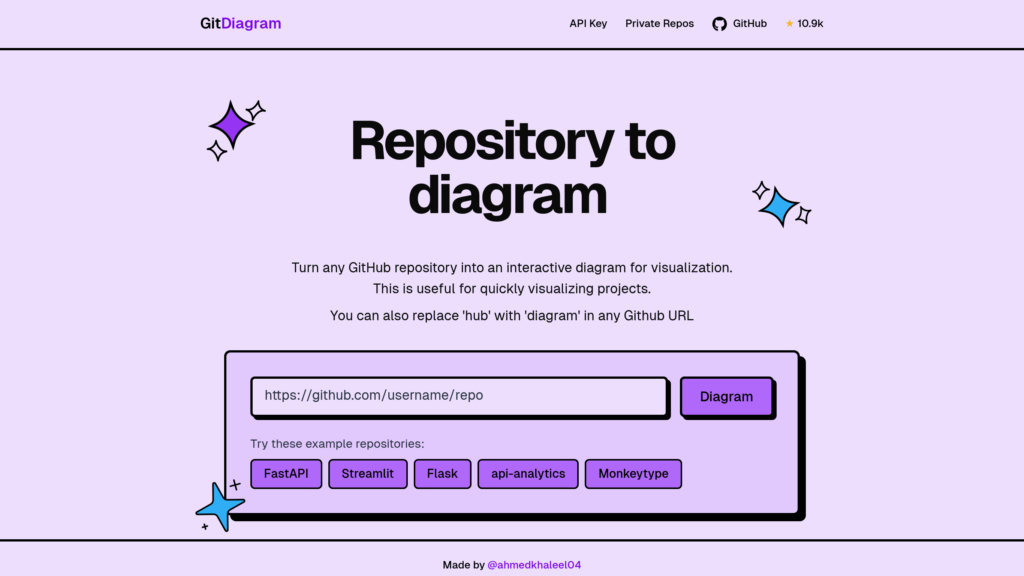
GitDiagram is a cutting-edge tool that allows users to convert any GitHub repository into an interactive diagram instantly. By simply replacing 'hub' with 'diagram' in the GitHub URL, developers can visualize their codebase architecture, facilitating better understanding and navigation of complex projects. Utilizing advanced AI technology, GitDiagram ensures fast and accurate diagram generation, making it a valuable resource for developers and project managers alike.
Key Features
Instant Visualization
Quickly transforms GitHub repository structures into interactive system design diagrams.
Interactive Navigation
Users can click on components in the diagram to directly access source files and directories.
AI-Driven Generation
Powered by Claude 3.5 Sonnet, ensuring rapid and precise diagram creation.
Customization Options
Supports modifications and regeneration of diagrams based on user-defined commands.
API Integration
Offers public API access for seamless integration with other tools (currently under development).
Use Cases
- Codebase Visualization : Developers can quickly visualize the structure of their projects, enhancing understanding and collaboration.
- Project Management : Project managers can use diagrams to present project architectures and dependencies clearly to stakeholders.
- Onboarding New Developers : New team members can familiarize themselves with project structures through intuitive visual representations.
- Documentation Enhancement : Enhances existing documentation by providing visual diagrams that complement textual explanations.
FAQs
GitDiagram Alternatives
CodetoFlow
AI-powered tool that converts code into interactive flowcharts to simplify complex logic and enhance code understanding.
Sketch2Scheme
AI-powered tool that converts hand-drawn flowcharts and diagrams into neatly arranged digital schemes with editable outputs.
PicDoc
Text-to-visual conversion platform that transforms written content into professional charts, diagrams, and infographics with intelligent editing capabilities.
ChartDB
Open-source, web-based database diagramming tool enabling instant schema visualization, editing, and AI-powered export.
Edraw.AI
AI-powered all-in-one visual collaboration platform offering 210+ diagram types, real-time teamwork, and intelligent content generation.
EdrawMax
Comprehensive all-in-one diagramming software offering 280+ diagram types with AI-powered automation and extensive collaboration features.
VDraw AI
AI-powered platform that transforms text, documents, and videos into professional infographics and flowcharts with easy customization and multi-format export.
Mermaid
Text-to-diagram platform that turns plain language or Markdown-style code into clean, shareable visuals in seconds, built by the creators of the open-source Mermaid.js.
Analytics of GitDiagram Website
🇺🇸 US: 36.26%
🇮🇳 IN: 13.72%
🇩🇪 DE: 6.92%
🇫🇷 FR: 6.09%
🇻🇳 VN: 5.63%
Others: 31.38%