ChartAI
AI-powered diagramming tool that generates professional charts and diagrams within seconds, simplifying data visualization and project planning.
InsForge
An agent-native alternative to AWS. Run full-stack apps end to end via CLI and skills
Product Overview
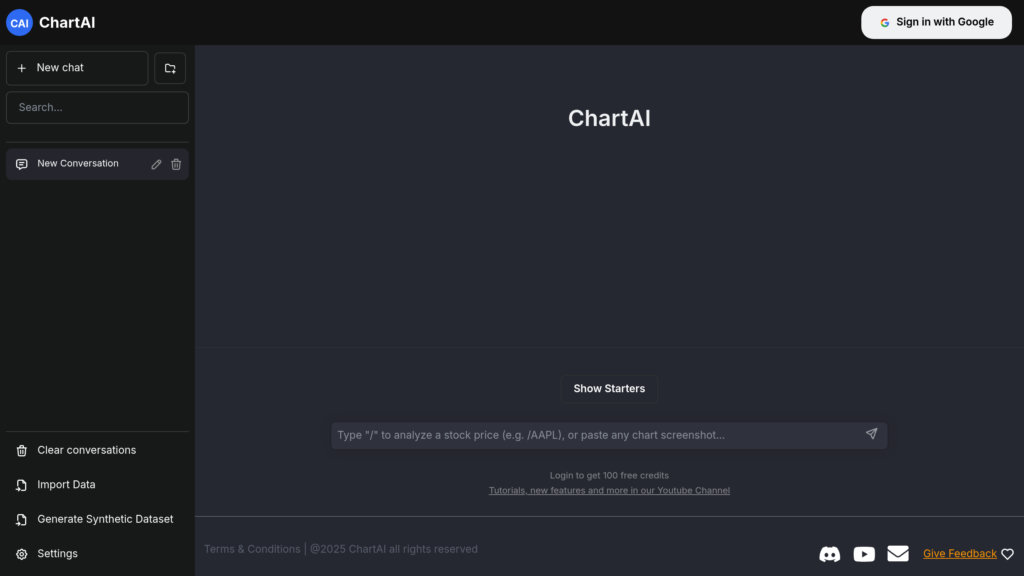
What is ChartAI?
ChartAI is an advanced AI-driven diagramming platform designed to help professionals, teams, and businesses create high-quality charts and diagrams quickly and effortlessly. Leveraging powerful AI models like GPT-3.5 and GPT-4, ChartAI transforms textual inputs into a wide range of visualizations including sequence diagrams, Gantt charts, user journeys, ER diagrams, flowcharts, mind maps, pie charts, class diagrams, and more. It automatically identifies task dependencies, optimizes timelines, and adapts charts dynamically, allowing users to focus on project goals without technical complexity. The platform supports data import, synthetic data generation, and offers customization options to meet diverse visualization needs. ChartAI provides a free beta with limited usage and plans a pro version for enhanced features and team collaboration.
Key Features
AI-Driven Diagram Generation
Automatically creates professional-quality diagrams and charts in seconds from simple text inputs, reducing manual effort.
Wide Range of Diagram Types
Supports sequence diagrams, Gantt charts, user journeys, ER diagrams, flowcharts, mind maps, pie charts, class diagrams, and more.
Timeline Optimization and Dependency Detection
AI identifies task dependencies and optimizes project timelines, keeping diagrams accurate and up-to-date.
Flexible AI Models and Customization
Integrates GPT-3.5 and GPT-4 with adjustable output settings, enabling tailored visualization and analysis.
Data Import and Synthetic Data Generation
Allows users to import datasets or generate synthetic data to enhance diagram creation and testing.
User-Friendly Interface and Accessibility
Intuitive design suitable for users of all technical levels, accessible on all devices with easy Google sign-in.
Use Cases
- Project Management : Create Gantt charts and flowcharts to plan, track, and optimize project timelines and task dependencies.
- UX Design and User Journeys : Generate accurate AI-powered user journey diagrams to visualize customer experiences without technical expertise.
- Data Analysis and Visualization : Use pie charts, bar charts, heat maps, and ER diagrams to interpret and present complex datasets clearly.
- Software Development : Develop sequence diagrams, class diagrams, and state diagrams to document system interactions and architecture.
- Education and Research : Facilitate learning and presentations by creating clear, professional diagrams and charts quickly.
FAQs
ChartAI Alternatives
Jeda.ai
Multimodal Conversational Visual AI Workspace that transforms complex data and ideas into interactive visuals for strategic analysis and decision-making.
妙办画板
Professional online drawing platform with intelligent diagram generation and real-time team collaboration capabilities.
Text to Flowchart Converter
AI-powered online tool that instantly converts plain text into professional, optimized flowcharts with multiple export options.
Cloudairy
A versatile collaborative workspace combining diagramming, mind mapping, and project management tools with AI enhancements to streamline team workflows.
Miro
AI-powered visual collaboration platform offering an infinite canvas for teams to ideate, plan, and innovate together seamlessly.
Mermaid
Text-to-diagram platform that turns plain language or Markdown-style code into clean, shareable visuals in seconds, built by the creators of the open-source Mermaid.js.
Lucidchart
Cloud-based intelligent diagramming platform enabling real-time collaboration, data visualization, and automation for diverse diagram types.
Whimsical
A purpose-built visual workspace for technical teams to diagram, wireframe, mind map, and brainstorm on an infinite canvas.
Analytics of ChartAI Website
🇺🇸 US: 18.07%
🇮🇳 IN: 15.24%
🇹🇷 TR: 11.45%
🇧🇷 BR: 6.09%
🇷🇴 RO: 5.66%
Others: 43.48%