Text2Infographic
AI-powered tool that converts text content into customizable, professional infographics quickly and easily.
Community:
InsForge
An agent-native alternative to AWS. Run full-stack apps end to end via CLI and skills
Product Overview
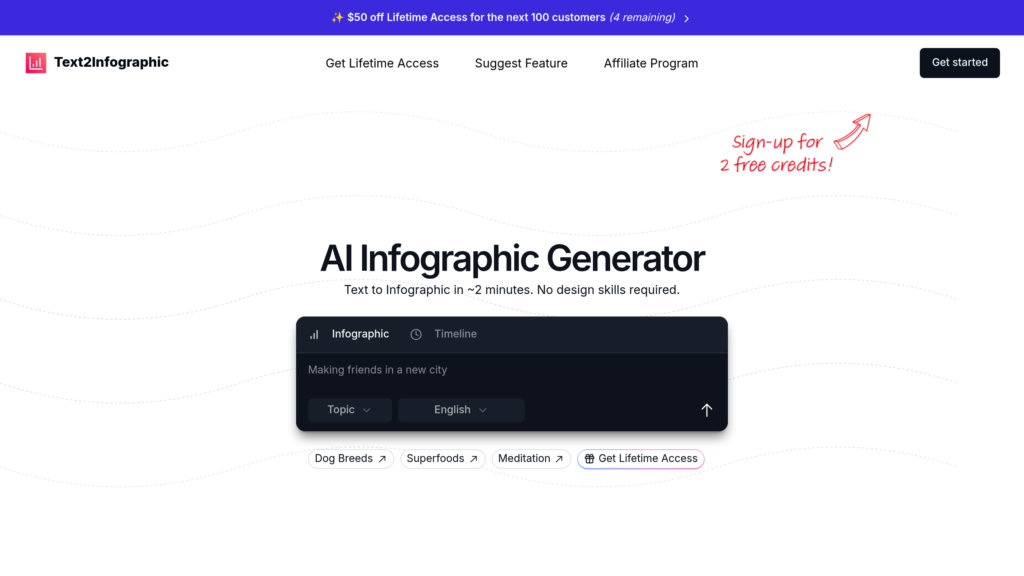
What is Text2Infographic?
Text2Infographic is an AI-driven platform designed to transform written content such as blog posts, documents, and spreadsheets into visually compelling infographics within minutes. It automates the extraction of key points and data visualization, enabling users without design skills to create engaging visuals that enhance communication and audience engagement. The tool supports multiple languages, offers extensive customization options including brand integration, and provides lifetime updates with a straightforward one-time pricing model.
Key Features
AI-Powered Infographic Generation
Automatically analyzes text input to extract key information and generate multiple infographic design options rapidly.
Multiple Input Formats
Supports conversion from blog URLs, text files, spreadsheets, and documents like Word or Google Docs.
Customization and Branding
Allows users to personalize infographics by adjusting colors, fonts, logos, and layouts to align with their brand identity.
Built-in Topic Research and Citations
Includes AI-assisted topic research to enrich content and automatically adds citations to sources.
Multi-Language Support
Operates in over 20 languages, making it accessible for global users.
Lifetime Access and Updates
One-time payment grants unlimited infographic creation, full commercial rights, and ongoing feature updates.
Use Cases
- Content Marketing : Marketers can quickly turn blog posts and reports into visually appealing infographics for campaigns and social media.
- Educational Materials : Teachers and instructional designers can simplify complex topics into engaging visual aids for students.
- Business Presentations : Professionals can enhance presentations by visualizing data and key points with custom infographics.
- Social Media Content Creation : Social media managers can produce eye-catching visuals to boost engagement on platforms like Instagram and LinkedIn.
- Internal Communication : Organizations can use infographics to clarify messages and data for teams and stakeholders.
FAQs
Text2Infographic Alternatives
爱设计
Online drag-and-drop design platform with 300,000+ commercial templates for marketing materials and social media content.
Krumzi
User-friendly platform for creating custom marketing images and videos that enhance social media presence and brand consistency.
Veeso AI
A content-first design platform that transforms text and files into professional visual layouts instantly, no design skills required.
简单设计
Free online design platform specializing in social media content creation with integrated image processing tools.
Robolly
Cloud-based platform for automated generation of personalized images, videos, and PDFs using dynamic templates and APIs.
GraphicInfo
AI-powered tool that transforms text into visually appealing infographics with one click.
Sivi AI
AI-powered design generator that instantly creates multilingual, branded visual content for marketing, social media, and web in minutes.
Orshot
Automated image generation platform that creates and scales marketing assets through templates, API integrations, and dynamic content workflows.
Analytics of Text2Infographic Website
🇺🇸 US: 12.64%
🇲🇽 MX: 8.68%
🇮🇳 IN: 7.97%
🇻🇳 VN: 7.61%
🇳🇬 NG: 6.38%
Others: 56.72%