AI Graph Maker
AI-powered online tool for creating diverse interactive charts and diagrams quickly with customizable design and multi-format export.
Community:
InsForge
An agent-native alternative to AWS. Run full-stack apps end to end via CLI and skills
Product Overview
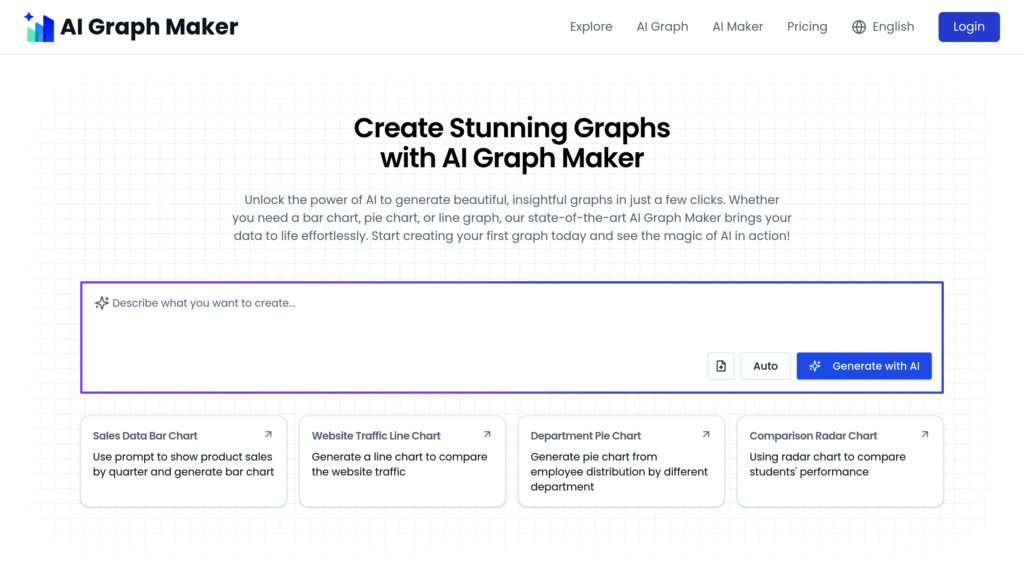
What is AI Graph Maker?
AI Graph Maker is a versatile and user-friendly online platform that leverages artificial intelligence to generate a wide range of professional charts and diagrams, including pie charts, line charts, bar charts, flowcharts, Gantt charts, ER diagrams, mind maps, and knowledge graphs. It automates data analysis and visualization, enabling users to create clear, insightful, and customizable graphics effortlessly. The platform supports multiple data input formats and offers flexible editing and export options, making it suitable for business, education, research, and project management.
Key Features
AI-Powered Chart Generation
Automatically analyzes input data and selects the most suitable chart type, streamlining the creation process and ensuring accurate visual representation.
Wide Chart Variety
Supports numerous chart types such as pie, line, bar, flowchart, Gantt, ER diagrams, mind maps, and knowledge graphs to cover diverse visualization needs.
Customizable Design
Allows users to modify colors, fonts, labels, icons, and layouts to tailor charts to specific styles and presentation requirements.
Multi-Format Export
Enables exporting charts in formats like PNG, SVG, PDF, Mermaid, and Vizmind for seamless integration into reports, presentations, and web platforms.
Multi-Modal Data Integration
Supports various input formats including plain text, Excel, PDF, DOCX, and URLs, facilitating quick conversion of unstructured or structured data into meaningful visualizations.
Responsive and User-Friendly Interface
Designed for both beginners and professionals, offering intuitive tools and templates that simplify the chart creation workflow.
Use Cases
- Business Reporting and Analytics : Create clear and professional charts to visualize financial data, project progress, and operational metrics for informed decision-making.
- Project Management : Utilize Gantt charts and flowcharts to plan, track, and communicate project timelines, task dependencies, and resource allocation effectively.
- Academic and Scientific Research : Generate line charts, scatter plots, and knowledge graphs to present research data, trends, and semantic relationships clearly.
- Marketing and Content Creation : Produce engaging visual content such as pie charts and radar charts to illustrate market analysis, customer segmentation, and competitive comparisons.
- Software and Systems Design : Use ER diagrams and mind maps for database modeling, system analysis, brainstorming, and conceptual organization.
FAQs
AI Graph Maker Alternatives
Prolific
A crowdsourcing platform providing high-quality, verified human data for research and AI model training with rapid participant recruitment.
Tableau
A leading visual analytics platform that empowers users to explore, analyze, and share data insights easily with AI-powered features and flexible deployment options.
秘塔AI搜索
Ad-free AI-powered search engine delivering direct, accurate results with multi-modal search capabilities and privacy-first design.
UserTesting Human Insight Platform
Comprehensive user research platform offering remote usability testing, participant recruitment, and AI-powered insights for product optimization.
Mermaid
Text-to-diagram platform that turns plain language or Markdown-style code into clean, shareable visuals in seconds, built by the creators of the open-source Mermaid.js.
PyTorch
Open-source deep learning framework providing dynamic tensor computation and flexible neural network building with strong GPU acceleration.
ResearchRabbit
AI-powered scholarly discovery tool that visualizes research literature and author networks to streamline academic workflows.
Refero
A structured library of real product interfaces — searchable by page type, UX pattern, company, or plain language — built for designers and AI agents alike.
Analytics of AI Graph Maker Website
🇷🇺 RU: 16.26%
🇺🇸 US: 8.25%
🇻🇳 VN: 6.36%
🇪🇸 ES: 5.38%
🇹🇼 TW: 5.3%
Others: 58.45%