Dash0
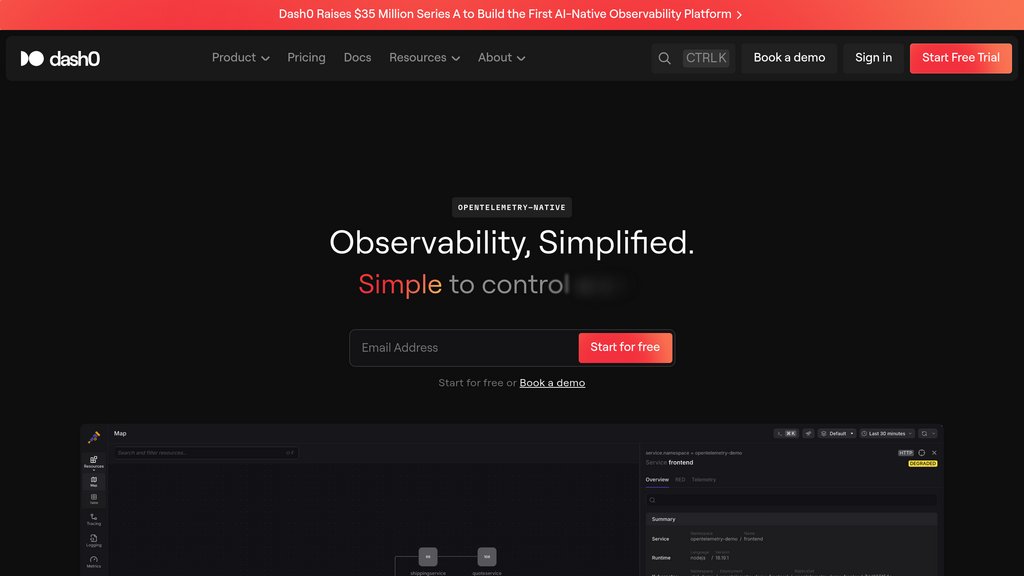
OpenTelemetry-native observability platform that centralizes logs, metrics, and traces with transparent pricing and open standards.
Community:
InsForge
An agent-native alternative to AWS. Run full-stack apps end to end via CLI and skills
Product Overview
What is Dash0?
Dash0 is an OpenTelemetry-native observability platform designed to simplify monitoring and troubleshooting for modern distributed systems. Built from the ground up on open standards like OpenTelemetry, PromQL, and Perses, the platform provides developers, SREs, and platform engineers with unified visibility into logs, metrics, and traces. Dash0 eliminates vendor lock-in while offering resource-centric monitoring, real-time filtering, and seamless cross-signal correlation. The platform features the SIFT framework (Spam filter, Ingest, Filter, Triage) to reduce telemetry noise, and Agent0, an SRE copilot that generates actionable artifacts like alerts, dashboards, and pipeline rules to accelerate issue resolution.
Key Features
OpenTelemetry-Native Architecture
Built entirely on OpenTelemetry standards for standardized data collection and analysis across distributed systems, ensuring interoperability and no vendor lock-in.
Unified Observability Platform
Centralizes logs, metrics, and traces in a single platform with cross-signal correlation, enabling seamless troubleshooting from metrics to traces to logs.
SIFT Framework
Four-pillar approach (Spam removal, Improve telemetry, Filtering/grouping, Triage) that intelligently reduces noise, enhances data quality, and automates root cause analysis.
Agent0 SRE Copilot
An intelligent assistant that diagnoses issues and generates actionable outputs like alerts, dashboards, and pipeline rules rather than just providing insights.
Kubernetes-First Monitoring
Native Kubernetes operator with auto-instrumentation for Java, Node.js, and .NET, plus automatic log collection and infrastructure metrics out of the box.
Transparent Usage-Based Pricing
Predictable costs based on the number of logs, spans, and metric data points sent—not by data size or user count—with full visibility into telemetry usage.
Use Cases
- Distributed System Monitoring : Engineering teams can trace requests across microservices, correlate telemetry signals, and identify performance bottlenecks in complex distributed architectures.
- Kubernetes Infrastructure Management : DevOps and platform engineers can monitor cluster health, workload performance, and resource utilization with automated instrumentation and pre-built dashboards.
- Incident Response and Troubleshooting : SRE teams can quickly pinpoint root causes using automated triage, cross-signal correlation, and real-time filtering to reduce mean time to resolution.
- Application Performance Optimization : Development teams can identify latency issues, error patterns, and resource inefficiencies through trace analysis and performance baselines.
- Cost-Efficient Observability Migration : Organizations transitioning from legacy tools can leverage OpenTelemetry standards to avoid vendor lock-in while maintaining predictable observability costs.
FAQs
Dash0 Alternatives
Rootly
AI-native incident management and on-call platform that automates response, streamlines collaboration, and accelerates resolution for engineering teams.
Mezmo
AI-enabled telemetry data pipeline and log management platform that optimizes, transforms, and routes observability data to reduce costs and accelerate incident response.
Devtron
A comprehensive Kubernetes application management platform that streamlines deployment, monitoring, and lifecycle management across multiple clusters.
Middleware.io
AI-powered full-stack cloud observability platform integrating logs, metrics, traces, and events into a unified timeline for faster issue detection and resolution.
K8sGPT
AI-powered Kubernetes tool providing intelligent cluster diagnostics, automated remediation, and multi-provider AI support with strong data privacy.
Struct
Automated on-call investigation tool that cross-references logs, metrics, traces, and your codebase to root-cause engineering alerts before you even open your laptop.
Better Stack
An integrated platform offering uptime monitoring, incident management, and log analysis to ensure website and infrastructure reliability.
WhyLabs
Comprehensive AI observability platform that monitors data and model health to ensure reliability, security, and performance at scale.
Analytics of Dash0 Website
🇩🇪 DE: 21.4%
🇳🇱 NL: 14.61%
🇺🇸 US: 11.18%
🇫🇷 FR: 4.38%
🇧🇷 BR: 2.74%
Others: 45.69%